Dear traders,
Did you notice that trend trading is only easy on paper, but spotting a trend becomes way more challenging on real live charts?
Perhaps you feel confused when you see price action build trends in the opposite direction?
In theory, trend trading sounds simple, but in practical terms, traders are often unsure about the real trend in the market.
Today’s article is an attempt to simplify the art and science behind trend trading, which is broken down into simple and manageable steps.
It is also important to understand the role of the trend within the market structure at the end of this article.

The Art and Science Behind Trends
Trend trading can be very beneficial, but not if traders are buying or selling at trend reversal spots. Basically, trend trading boils down to these simple steps:
- TREND: Reading the direction of the trend correctly;
- CORRECTION: Recognising corrections within the trend;
- REVERSALS: Monitoring reversal signals for the end of the trend.
The problem with trend trading is that the chart often becomes confusing, and, eventually, paralysis of analysis could occur. The best approach to avoid the two aspects is to:
- Only choose one or two time frames for trend spotting;
- Do not add more than two or three indicators for measuring the trend;
- Wait for the pullback (correction) within the trend before entering.
I will discuss my favourite tools and indicators in the next paragraphs. Feel free to check out the video below about trend trading as well!
Moving Averages Provide an Instant Overview
The first critical step to understanding the trend is adding moving averages (MA) to the chart. The moving averages are a dynamic indicator as they are automatically re-calculated after each candle.
The major benefit of the MA is that you can immediately see whether the price sequence is trending or ranging:
- Uptrend: The price is above the moving average, and the MA shows a bullish angle.
- Downtrend: The price is below the moving average, and the MA shows a bearish angle.
The technique becomes even more valuable if a second MA (a third, even) is added to the chart as traders can read short, medium, and long-term trends. Here is how I use the MAs (I use the EMA close):
- Uptrend: The price is above 21 EMA, which is above 144 EMA.
- Downtrend: The price is below 21 EMA, which is below 144 EMA.
- Range: 21 EMA and 144 EMA are touching.
We now know the trend, but as mentioned above, it is critical to wait for a correction first; otherwise, the entry could occur at a top, bottom, or simply at an inappropriate moment.
The price is still considered to be in a trend, albeit in a correction, when this happens:
- Correction in uptrend: The price is below 21 EMA, which is above 144 EMA.
- Correction in downtrend: The price is above 21 EMA, which is below 144 EMA.
The moving averages help determine whether the price is in a correction, trending, or ranging after a quick glance at the charts.
On a side note, the middle of the Admiral Keltner indicator (MT4 SE) is more or less the same as the movement of the 21 EMA close. Hence, a trader can use the same indicator (Keltner) for two totally different purposes.
 Source: Chart from Admiral Markets MT4 SE-EUR/USD 1h Chart, 12-21 May 2017
Adding a New Dynamic: Trend Channels and Fractals
Trend channels are effective in measuring the trend, but do require manual work from the trader. These characteristics are pre-requisites for a trend channel to be valid:
- Presence of an angle: Bullish for uptrend, bearish for downtrend;
- An angle of preferably 20 degrees or more;
- The price respecting the bottom or top at least two or three times:
- The bottom in an uptrend channel;
- The top in a downtrend channel.
Again, the trending structure is clear, but when does a retracement occur?
Once a channel is formed, it is important to wait for the price to build a retracement:
- Uptrend: The price retraces to the bottom, half or quarter of the channel;
- Downtrend: The price retraces to the top, half or quarter of the channel.
The trend is invalidated if the price breaks below the support trend line of the channel or above the resistance trend line of the channel. In that case, a reversal might be taking place, rather than a correction.
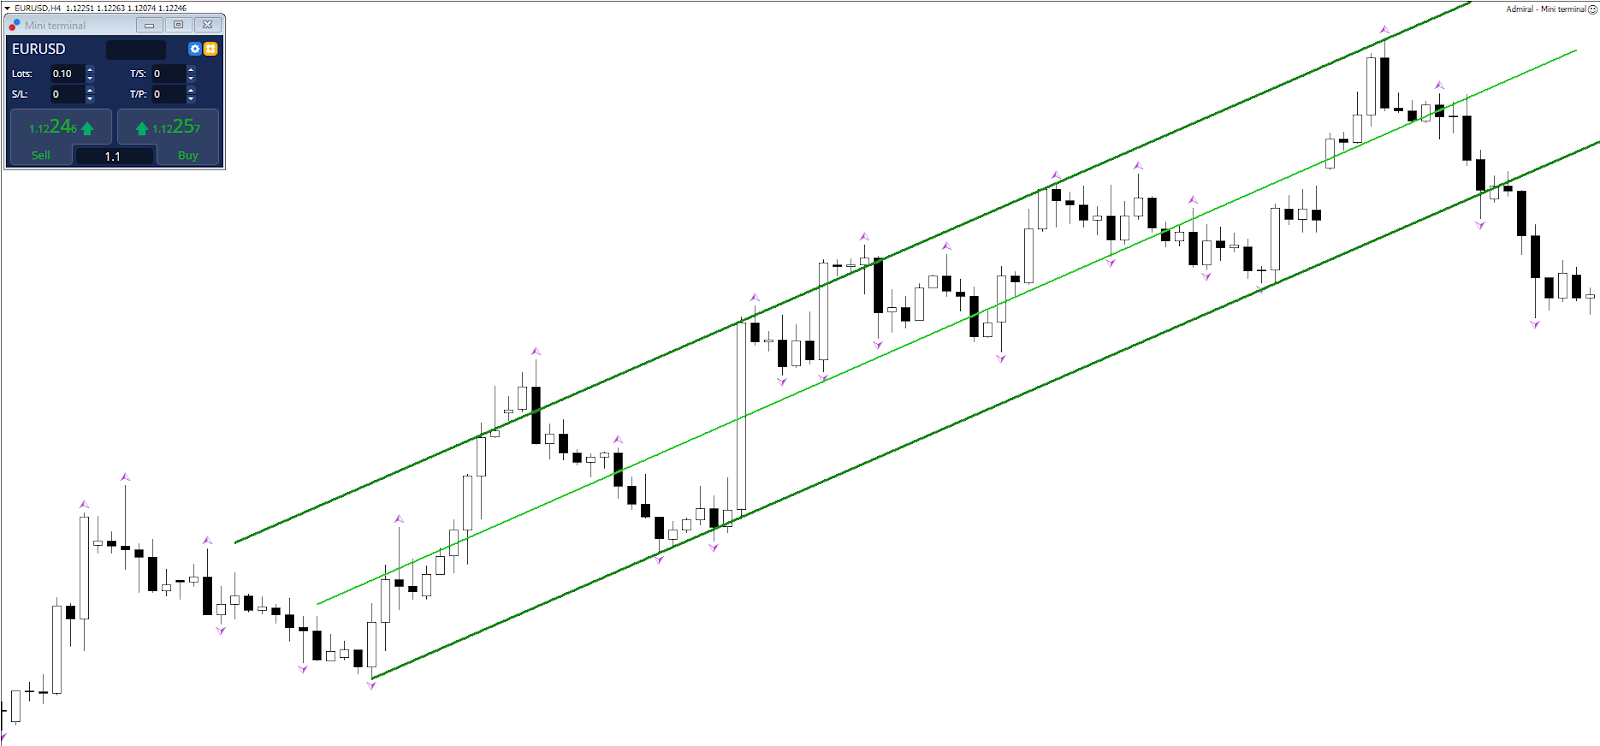
Source: Chart from Admiral Markets MT4 SE-EUR/USD 4h Chart, 2 March-1 April 2017
Last but not least, the Fractal indicator automatically offers a simple method of spotting the classical definition of trends:
- Uptrend: Higher highs and higher lows;
- Downtrend: Lower lows and lower highs.
Of course, traders can try to spot the trend sequence without the Fractal… but the Fractal indicator makes it easier and quicker to spot the trend pattern when scanning the charts.
Conclusion
It is important to recognise and trade the trend. In my experience, the above-mentioned tools work well, but don’t forget to try the 60+ extra features of Admiral Markets’ MetaTrader 4 Supreme Edition.
To sum up, being a trader, try to keep in mind the following:
- Don’t expect the trend to continue in the same direction, especially, if you are new to trading;
- Understand when reversals (see the video below) and corrections are more likely to occur.
Cheers and safe trading,
Chris Svorcik


