Monthly S&P500 Emini futures candlestick chart: Double top in bull trend
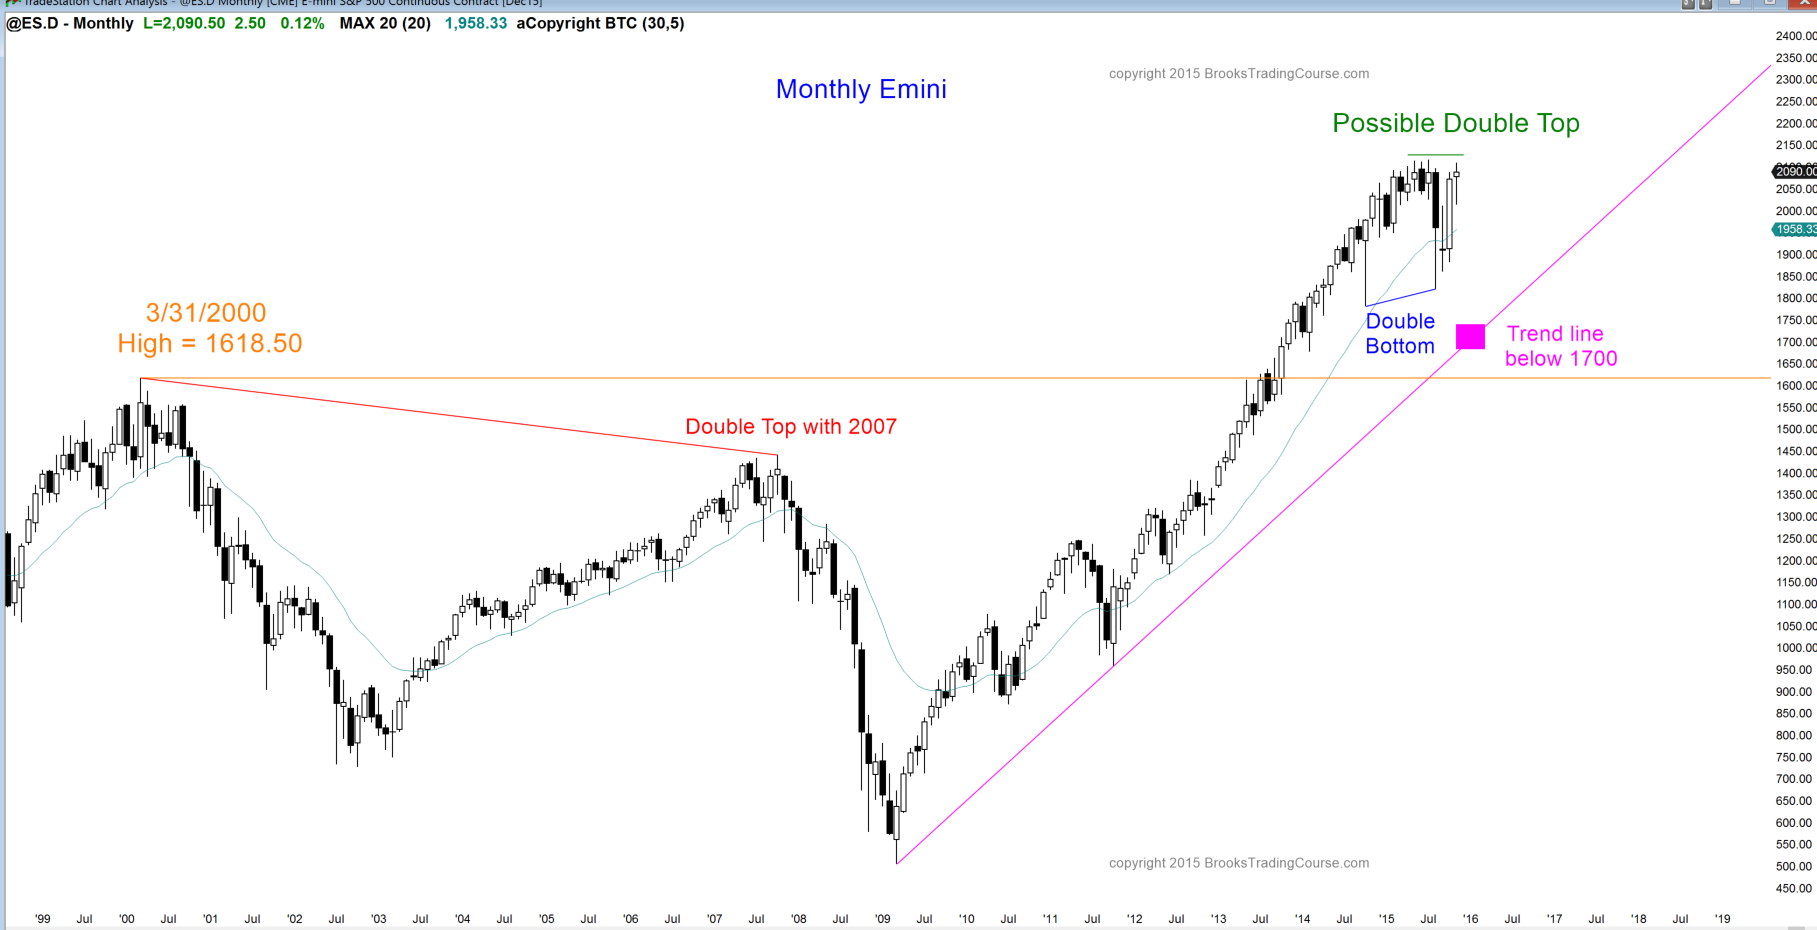
The monthly S&P500 Emini futures candlestick chart has one trading day left in the month. The candlestick pattern in November so far is a doji bar, which is a one bar trading range and a sign that November was a neutral month.
The open of the month was 2076.75. With the current price so close, the Emini is telling us that it is paying attention to the open of the month. Traders learning how to trade the markets should realize that it will be a magnet on Monday, especially in the final hour and especially if it is within 5 points. Those who trade for a living will watch for the market to race toward the open of the month in the final hour or two. If the Emini is within 5 points of the open after 11 a.m. on Monday, there is a 70% chance that it will get to within 1 point of it before the end of the day. Day traders know this and will be ready for a quick trade if the setup is present.
The bulls want Monday’s close to have a bull body, even if the body is small. This would be a sign of follow-through buying after October’s strong bull trend bar, and it would make traders slightly more confident that there will be additional follow-through buying and a new all-time high. The bulls prefer that the month close on its high and above the all-time high of 2117.00, but those targets are probably too far to be reached on Monday, given that 5 of the past 6 days have been small doji days.
The bears always want the opposite of the bulls. They want a bear close. They prefer a close below the middle of the month’s range, which would then create a bear reversal bar on the monthly chart. This would then be a plausible sell signal bar for the bears, who would then see the 2-month rally as the 2nd top of a double top with the July all-time high.
The bulls had a 20 gap bar buy signal when August finally pulled back to the 20 month moving average, after being above it for 38 months. Although 38 months above the moving average is a sign of strong bulls, it happened 7 years and more than 80 bars into a bull trend on the monthly chart. Those who trade the markets for a living know that it is therefore also a buy climax. When there is a buy climax, traders learning how to trade the markets need to know that there is a 50% chance of a TBTL Ten Bar, Two Legged correction.
The selloff from the July all-time high lasted one month and the rally has lasted 3 months. This is a 4 bar correction and it has not had a 2nd leg sideways to down. Unless the Emini breaks strongly above the July high, there is still a 50% chance of a 2nd leg down that might last 5 or more months. It can even happen if the bulls get their breakout to a new all-time high.
Sometimes the 1st pullback from a reversal down from a buy climax goes back above the top of the buy climax before the 2nd leg down begins. The bulls need a strong breakout and follow-through above the all-time high before traders will believe that the bull trend is resuming. The bears want a double top or a higher high major trend reversal down to the October low. At the moment, they both have a 50% chance of success.
Weekly S&P500 Emini futures candlestick chart: Candlestick pattern is a major trend reversal
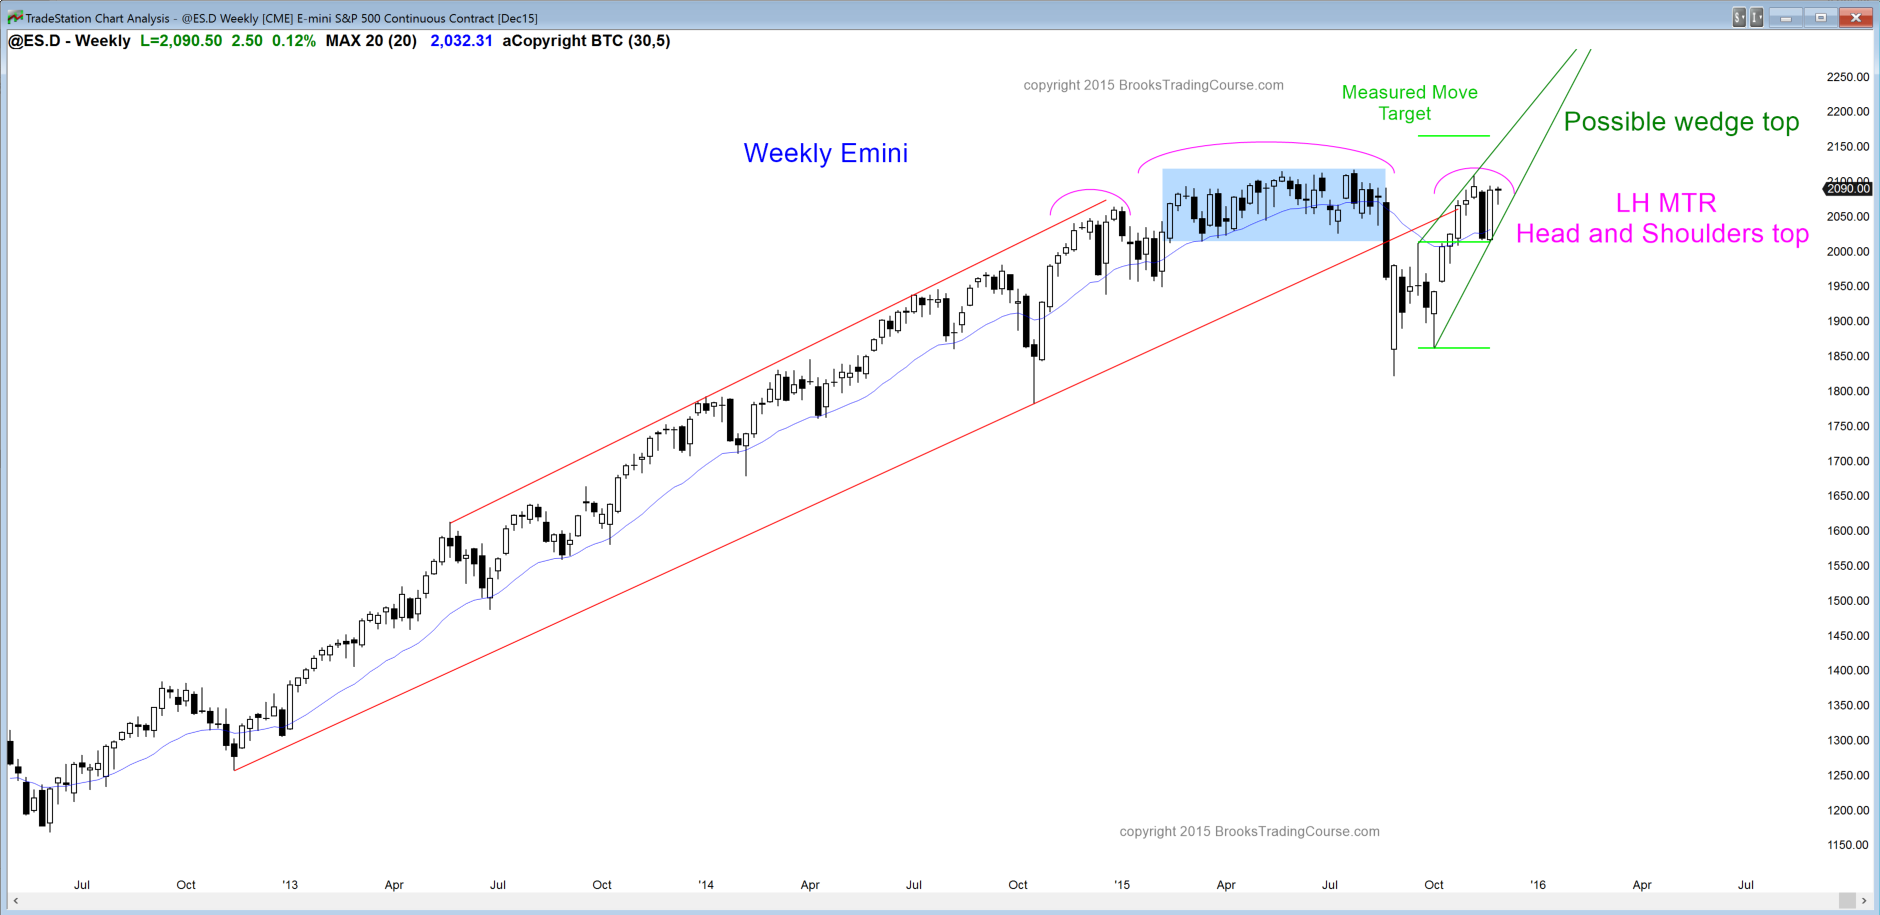
The weekly S&P500 Emini futures candlestick pattern was a doji this week, which represents trading range price action and poor follow-through from last week’s strong bull trend bar. It has been in a tight trading range for 5 weeks and is in breakout mode. The August sell-off had 4 bars completely below the moving average, and were therefore moving average gap bars. When a bull trend forms moving average gap bars late in a bull trend, the rally that follows has a 60% chance of forming a major trend reversal.
The bears are currently preventing the bulls from reaching a new all-time high. If the Emini turns down from here, it would form a lower high major trend reversal. If it turns down from above the July high, it will form a higher high major trend reversal. Sixty percent of major trend reversal tops are followed by trading ranges. Forty percent are followed by a swing down. The first target for the bears is a break below the November low and the moving average, and then a measured move down. Their final targets are the October higher low and then a breakout below the August bear low.
The bulls want a breakout above the all-time high and they want it to be composed of several consecutive big bull trend bars closing on their highs. If they get it, they will watch the 1st pullback. If it stays above the July high, they will assume that the breakout is a measuring gap, and they will try to swing trade their longs for a 300-point rally. Remember, there is a 60% chance of a top, so there is only a 40% chance of a successful strong bull breakout.
Even though there is a double top with the July high and this week is a sell signal bar, it is a doji. Given that it follows a big bull trend bar, the odds are that there are buyers below for at least a little more sideways to up.
Daily S&P500 Emini futures candlestick chart: Trading range after the October buy climax
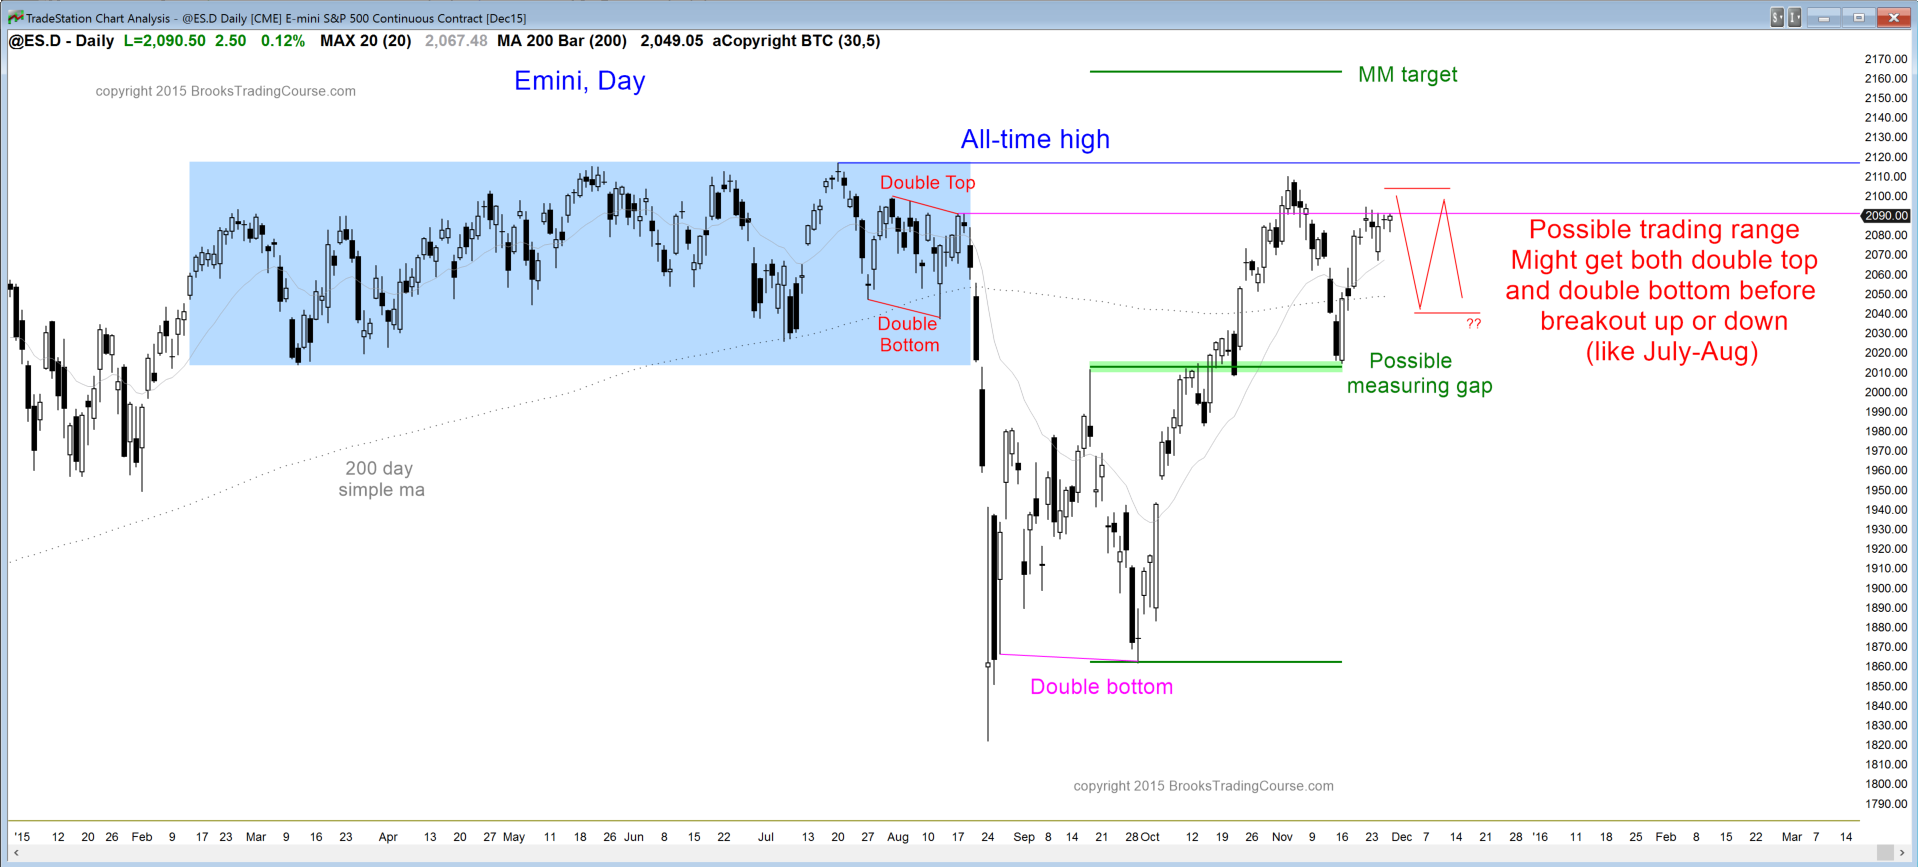
The daily S&P500 Emini futures candlestick chart has had 5 dojis in the past 6 days, and they are in a tight trading range. The bulls see this as a bull flag and expect a bull breakout next week. The Emini has been unable to hold above the August top of the bear trend, but it has not reversed down yet. Each of the past 5 days topped out within a few points of that high. It is still in breakout mode.
There are the obvious targets of the November and all-time highs just a little above. Resistance is always a magnet, and the odds are that the Emini will test at least a little higher in the next week or two. The bears do not mind a rally if it fails, and want either a double top lower high major trend reversal with the November high, a double top with the all-time high, or a big higher high major trend reversal down from above the all-time high. They will continue to short and scale in higher until there is a strong bull breakout with follow-through.
The bulls see the strong reversal up on November 16 as especially important. It was a breakout test of the September high, and the reversal up from the pullback created a gap with that high. The bulls want the gap to be a measuring gap. The projection up is about 150 points above the September high, which was the neckline of the August-September double bottom.
The October buy climax was extreme enough to make a trading range likely. A trading range usually has at least 2 legs up and 2 legs down. There has been only one leg down and one leg up, and the odds are that the daily chart will go sideways for at least another few weeks before it has a breakout up or down. However, if a strong breakout comes before then, traders cannot be in denial and they must trade.
The trading range price action lowers the probability that a strong move up or down will result in a breakout. Traders have to be careful about buying a strong leg up at the top of a trading range or selling a strong leg down at the bottom. There is no breakout until the Emini clearly goes 20 or more points beyond the range. Until there is a breakout, there is no breakout, and the probability is that every strong rally and selloff will continue to reverse.
Original post was published at Al Brooks Price Action Trading Blog. Check Brooks Trading Course and get the most comprehensive source of information on price action trading available!


