Monthly S&P500 Emini futures candlestick chart: Triangle bull flag
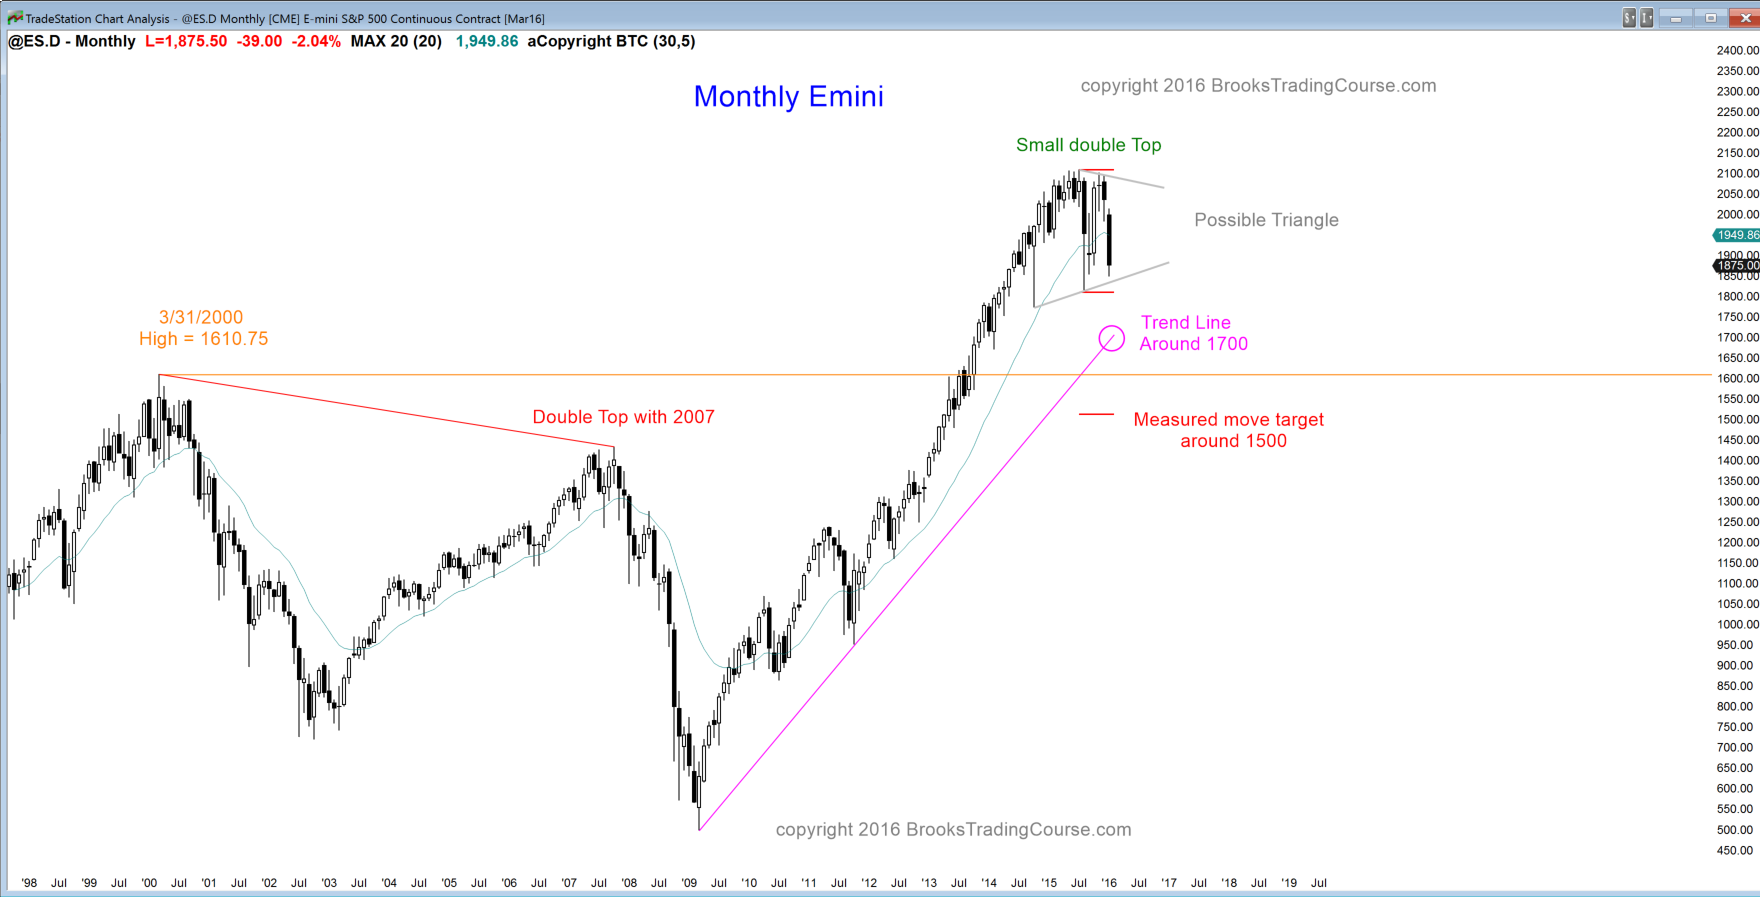
The monthly S&P500 Emini futures candlestick chart has 2 weeks left to the month and the candlestick pattern might be different from what it is today. It is currently a big bear trend bar that is creating a 3rd push down in a 16 month trading range. The 1st push was the October 2014 selloff and the 2nd occurred in August 2015. The current selloff is holding above the low of the other 2, and the entire pattern is a triangle.
The bears see a double top with the July 2015 and October 2015 highs. Every trading range has both a bull and a bear pattern, as is the case here. In general, they both have about a 50% chance of success, which means that the bulls and bears are balanced. It always looks like the bulls have a higher probability when there is a strong leg that races to the top, and that the bears have the edge during selloffs. This is deceptive. The more bars that get added to a trading range, the close the probability is to 50% for both the bulls and the bears. That is the case now on the monthly chart. Until there is a strong breakout either way, with good follow-through, the odds are that each of these strong legs up and down will continue to fail, per my 80% rule (80% of breakout attempts fail in trading ranges, and 80% of reversal attempts fail in trends).
I have repeatedly written for over a year that there was an 80% chance that the upside was going to be limited until after a correction of at least 10 bars (months) and at least 10 – 20% because of how unusually overbought the monthly chart was. The correction has lasted at least 10 bars (months) and it has had 2 legs. This is enough so that the bulls, who have refused to buy over the past year because of the buy climax and the inherent risk of a deep correction, are now becoming willing to buy. If they can strongly reverse the Emini back up over the next couple of weeks, they will have taken control back from the bears and the Emini will again be balanced.
Until there is a breakout up or down, control will continue to switch back and forth every 2 – 3 bars (months), but the probability of the breakout being up or down remains around 50%. The chance of a test of the bull trend line around 1700 is about 40%, and the chance of a test of the double top breakout point around 1600 is about 30%.
Weekly S&P500 Emini futures candlestick chart: Possible 2nd leg bear trap in 16 month trading range
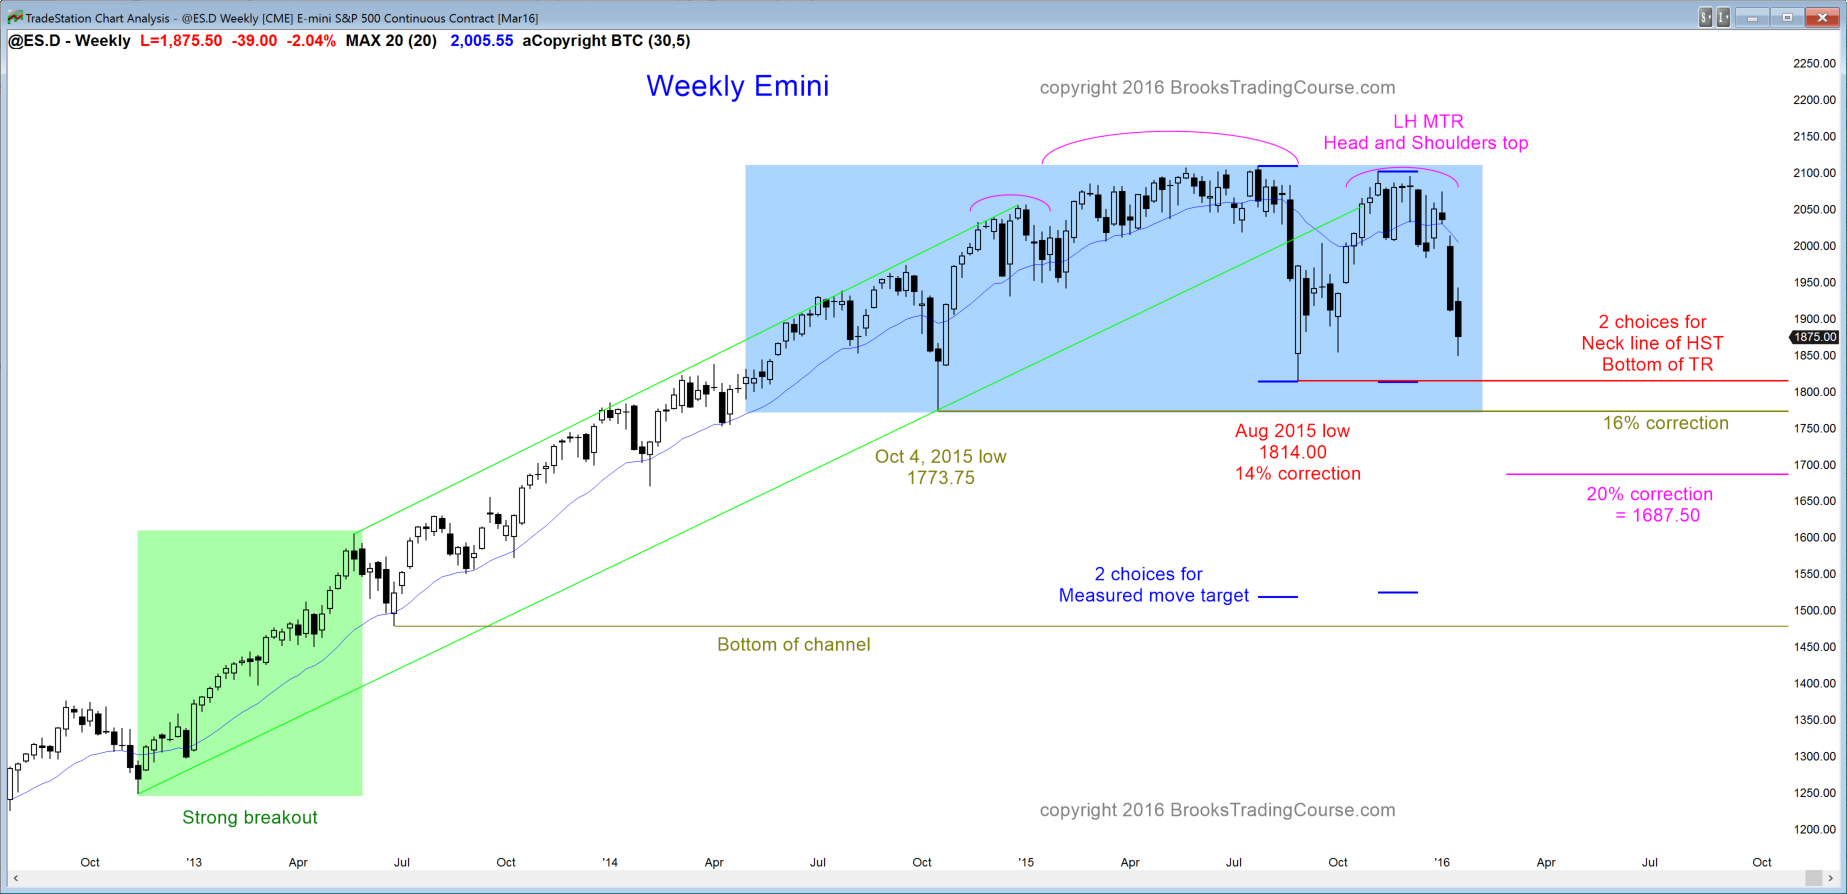
The weekly S&P500 Emini futures candlestick chart is also in a triangle, but a much larger one. The reversal points are the same as on the monthly chart. Although the past 2 weeks were big bear candlesticks, and the selloff now has lasted about 10 weeks, until there is a strong breakout, each strong move up or down will more likely reverse than break out. These past 2 weeks still might simply be a sell vacuum test of support, which is the bottom of the 16 month trading range.
This week’s bear body was small, and it has a prominent tail below. Both are signs of a loss of momentum. The bears are taking profits quicker now that the Emini is near the bottom. This weakens the bear case. The bulls are also beginning to buy. The bulls see this 2 week selloff as a 2nd leg trap in a trading range. Trading ranges are filled with 2 legged moves up and down. The first leg was the November 13 big bear bar. Then there was a 7 bar sideways pullback, followed by the strong 2nd leg down of the past 2 weeks. If they are right, there will be a reversal up that will start either next week or the following week.
If the bears are truly at the start of a bear trend, the reversal up will be small. For example, the weekly chart could enter a tight trading range for about 5 bars and form a small Low 2 short (ABC) bear flag just below the moving average. That could lead to the bear breakout below the October 2014 and August 2015 double bottom, and then a bear trend that falls for about a measured move.
At the moment, the weekly chart is far less bearish than TV would lead you to believe. The chance of a successful bear breakout is still only 50%, the chance of a 20% correction is less than 40%, and the chance of a test of the measured move targets around 1500 is about 25%. The probabilities are not identical to those on the monthly chart because they are different charts and every chart has elements that are unique to its chart and are not present on other time frames.
Daily S&P500 Emini futures candlestick chart: Day trading tip is to look for a rally after the sell climax at support
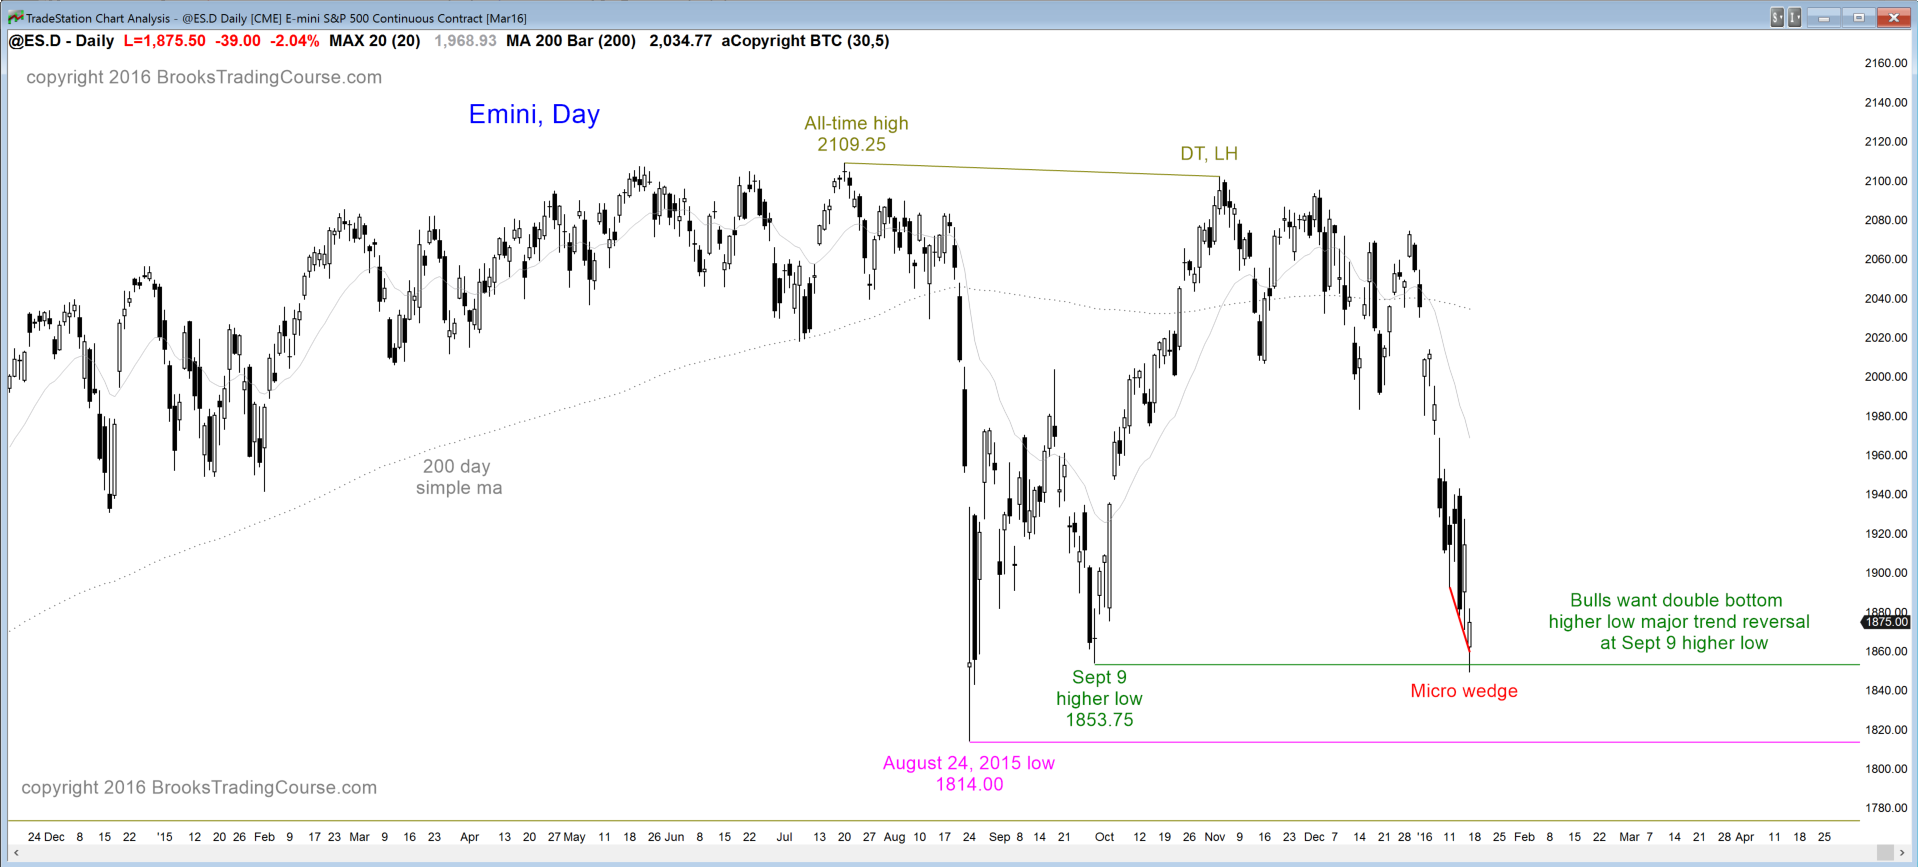
The daily S&P500 Emini futures candlestick chart had a brief bear trend in August 2015. It formed a higher low major trend reversal on September 9. The rally failed to reach a new all-time high. As big as the October rally was, because it stayed within the trading range, it was “minor,” which means that it was a bull leg in a trading range.
This week tested below the September 9 low. It did so with a 5 day micro wedge, and it had a bull candlestick pattern on Friday. The bulls see this reversal as a double bottom with the September 9 low, and therefore a double bottom higher low major trend reversal.
When there is a reasonable major trend reversal, a loss of bearish momentum (a micro wedge) and a good buy signal bar, there is a 40% chance of a TBTL swing up (lasting Ten or more Bars, and Two or more Legs). There is a 60% chance of at least a bounce. This means that there is a 60% chance of a bounce over the next week or two. The initial target is the top of the wedge bear channel, which is the high of the January 8 or 13 sell climaxes around 1950. This is usually around the moving average. Traders will be looking to buy next week.
A micro wedge is a series of sell climaxes, and this one formed in a bigger sell climax. When there are several sell climaxes, the bears begin to take profits because their stop is now too far. They need to reduce risk. The bulls know this and they begin to buy for “scalps” (on the daily chart, these are fast money buys that last 1 – 5 days). With both bulls and bears buying, the Emini can rally.
There is a 30% chance that the selloff will continue through next week and fall below the August 24 low without bouncing first. When there is a wedge bottom and then a bounce, about a third of the time, the selloff resumes before the rally reaches its target. If the bear trend resumption falls below the wedge bottom (Friday’s low), like anytime there is a credible place for bulls to place a stop, there is a 50% chance that the bear breakout will fall for about a measured move down (the wedge is about 90 points tall).
There is also a 50% chance that the bear breakout will fail and be followed by another reversal up (buy signal bar). Markets often need a 2nd bottom attempt before a reversal succeeds, especially when the selloff has been in a tight bear channel, like this one. When a bear channel is this tight, the 1st reversal up is usually minor. This means that it typically lasts 5 – 10 bars and then tests back down. Once it tests back down, the bulls will try for a major trend reversal of the bear trend that began at the October high. Less likely, the reversal will accelerate up without a test down.
See the weekly update for a discussion of the price action on the weekly candlestick chart and for what to expect going into next week.


