Monthly S&P500 Emini futures candlestick chart: Triangle after buy climax
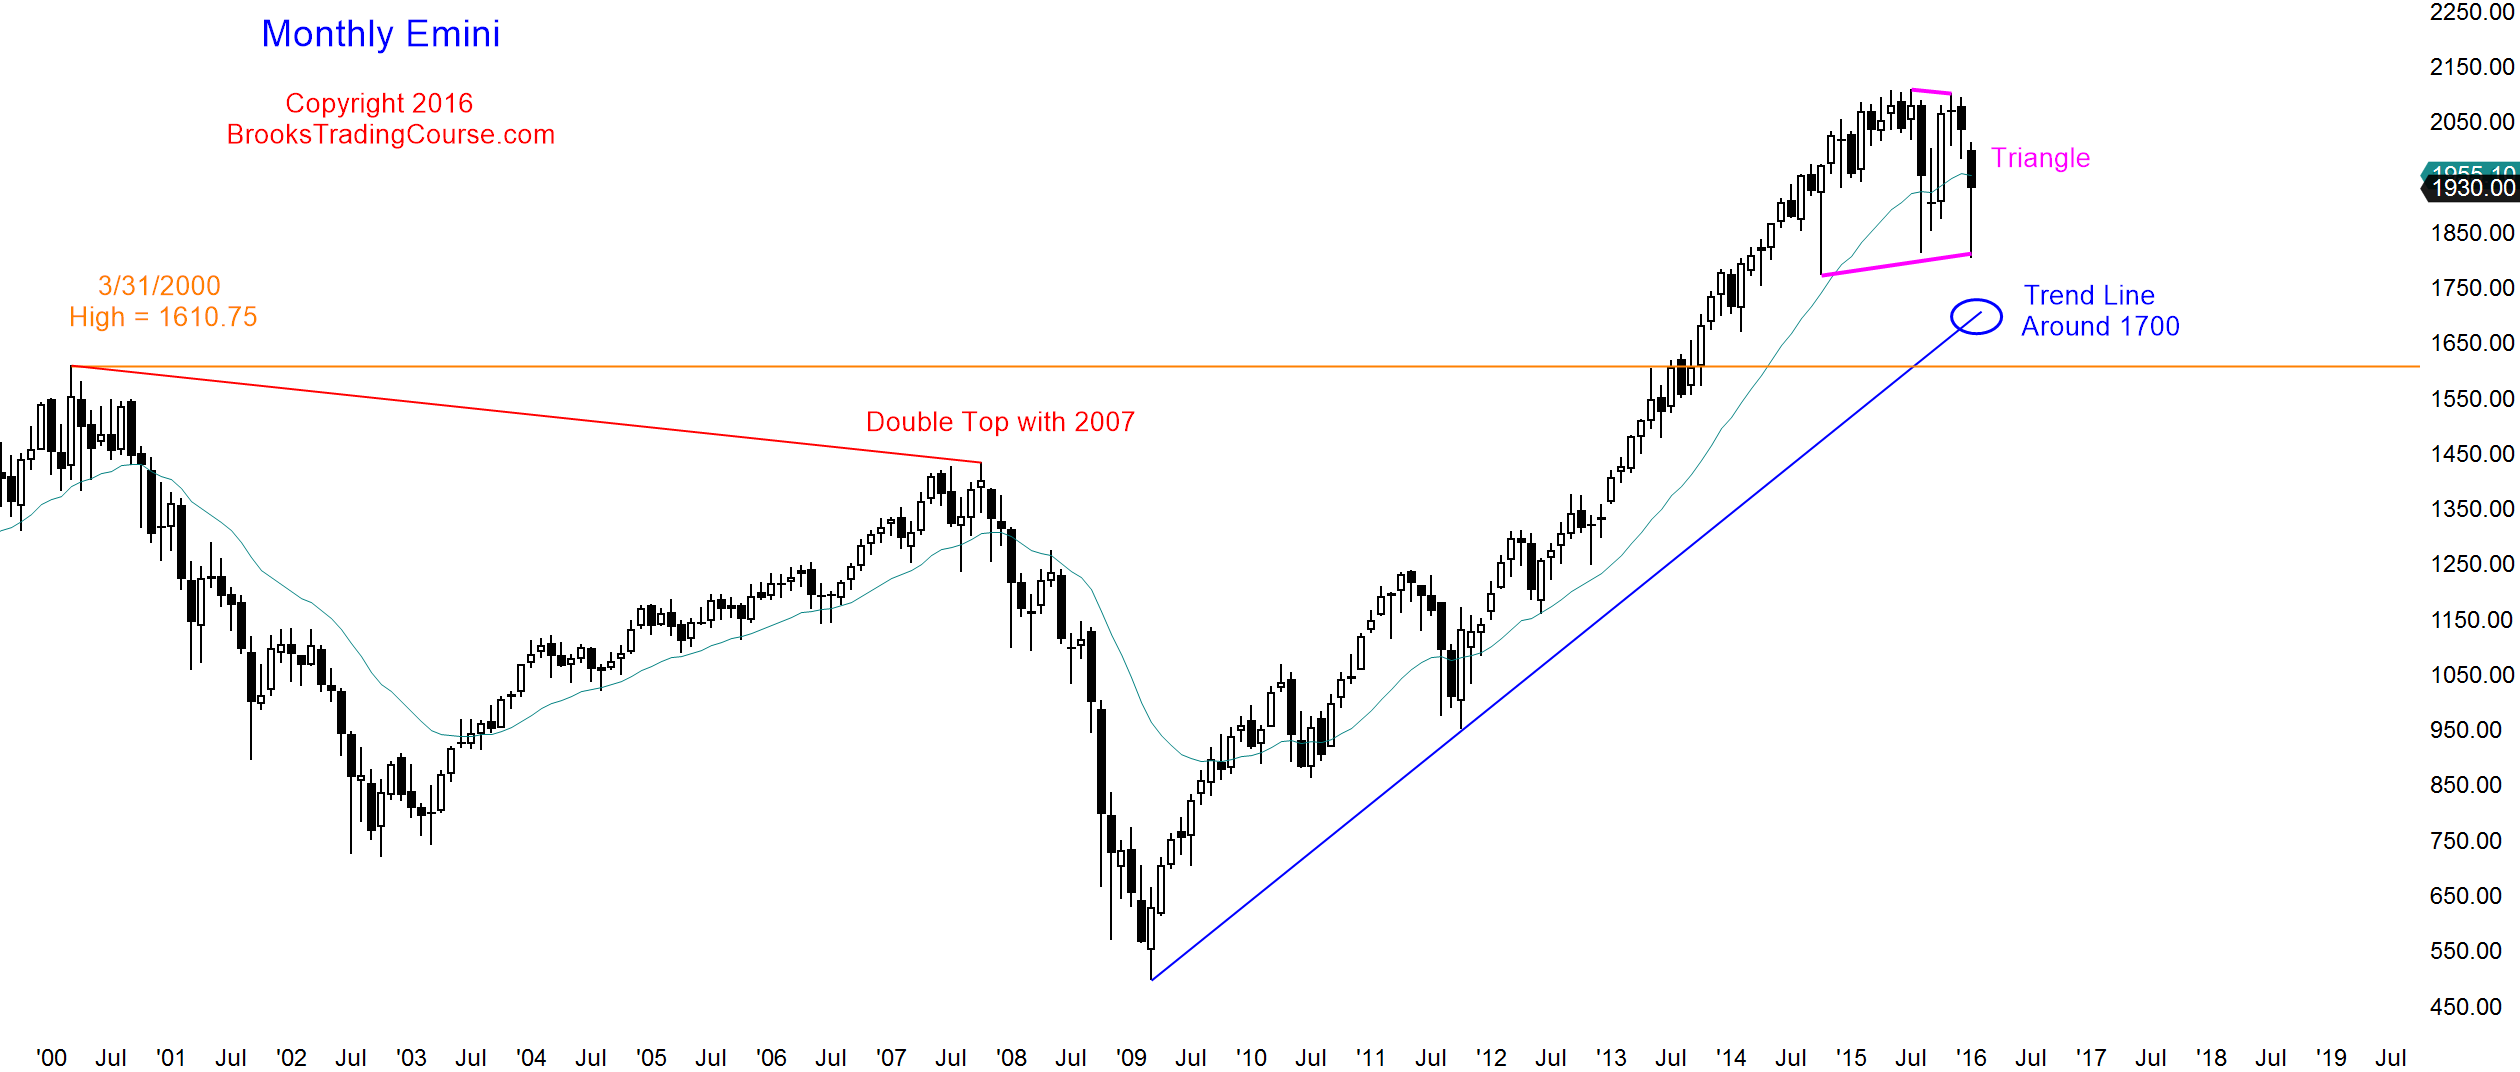
Although the daily chart is giving traders a chance to learn how to trade a bull breakout above a bear flag, the monthly S&P500 Emini futures candlestick chart, with the current reversal up from the bottom of the 2 year trading range, is now a triangle. This is a horizontal trading range that has 3 pushes up or down. Calling it a triangle adds nothing because the tight trading range is already a breakout candlestick pattern. This means that the probability of a bull breakout is about the same as for a bear breakout (50%), and the probability that the 1st breakout will reverse is also about 50%.
Friday was the last trading day of the month and it therefore affected the appearance of the monthly candlestick pattern. The month barely closed above its midpoint after a failed breakout below the August low. This is good for the bulls. It had a bear body and closed below the moving average, which is good for the bears.
There is no indication that a successful breakout is imminent, but one can come at any time. In general, a trader makes more money betting on inertia than betting on a change in the price action. Eighty percent of trading range breakout attempts fail. It is more likely that every move up and down will reverse than breakout. Until there is a breakout, there is no breakout. Traders learning how to trade the markets should not get too hopeful whenever there is a strong move up or down, especially on lower time frames like the daily and weekly charts, when the monthly chart is so completely neutral.
Weekly S&P500 Emini futures candlestick chart: Failed breakout below trading range
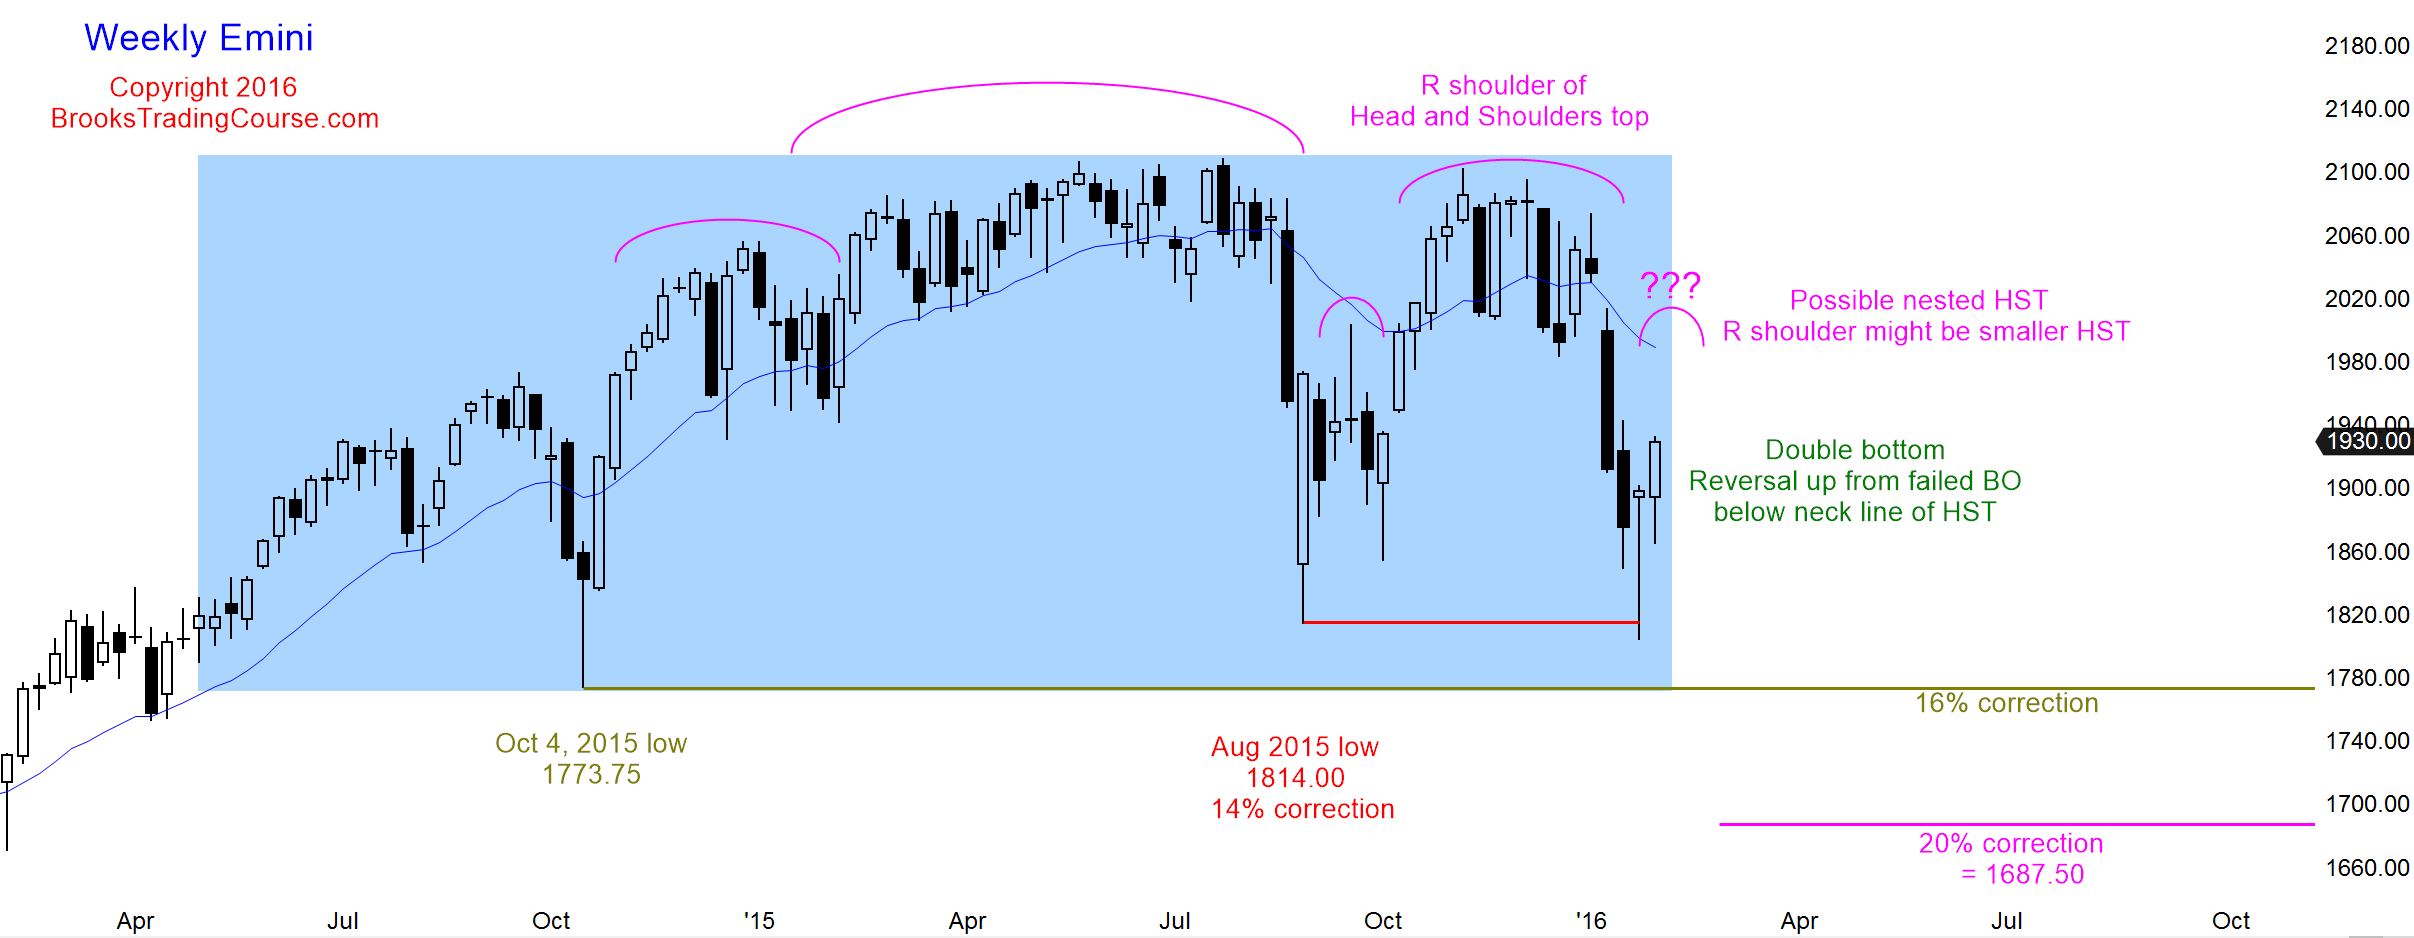
The weekly S&P500 Emini futures candlestick chart has been in a trading range for close to 2 years, depending on where one chooses to label the start of the range. Two weeks ago, the Emini reversed up from a breakout below the range. The buy signal bar had a small bull body and a big tail. That is not a strong buy signal, especially following 2 big bear trend bars closing on their lows. As strong as the reversal up has been for the past 2 weeks, it is still more likely that this reversal is minor. A minor reversal is a bull leg in a trading range and not the start of a bull trend. While there might be a 30% chance that this is the start of a strong bull trend that breaks out to a new all-time high, there is a 70% chance that this rally will only last for a few weeks and then test back down.
If the rally reverses down from around the moving average, it would also be reversing down from the bottom of the 2015 trading range, and traders would see the rally as simply a breakout test (a pullback to the breakout area). This area is also around the September 18 high, and the Emini might be creating a nested Head and Shoulders Top. A nested pattern is one where the final leg subdivides into a smaller version of the same pattern. Here, the right shoulder on the weekly chart began with the rally from the August 2015 low.
If the current rally reverses down from the resistance levels that I just described, the entire right shoulder would contain a small Head and Shoulders Top, with its head being the right shoulder of the larger pattern. Nested patterns are important because they increase the probability of the pattern doing what traders think it might do. This is because 2 or more time frames are doing the same thing. The smaller nested pattern is a big pattern on a smaller time frame chart (the daily chart has a potential big Head and Shoulders Top).
Daily S&P500 Emini futures candlestick chart: Learn how to trade a bull breakout above a bear flag
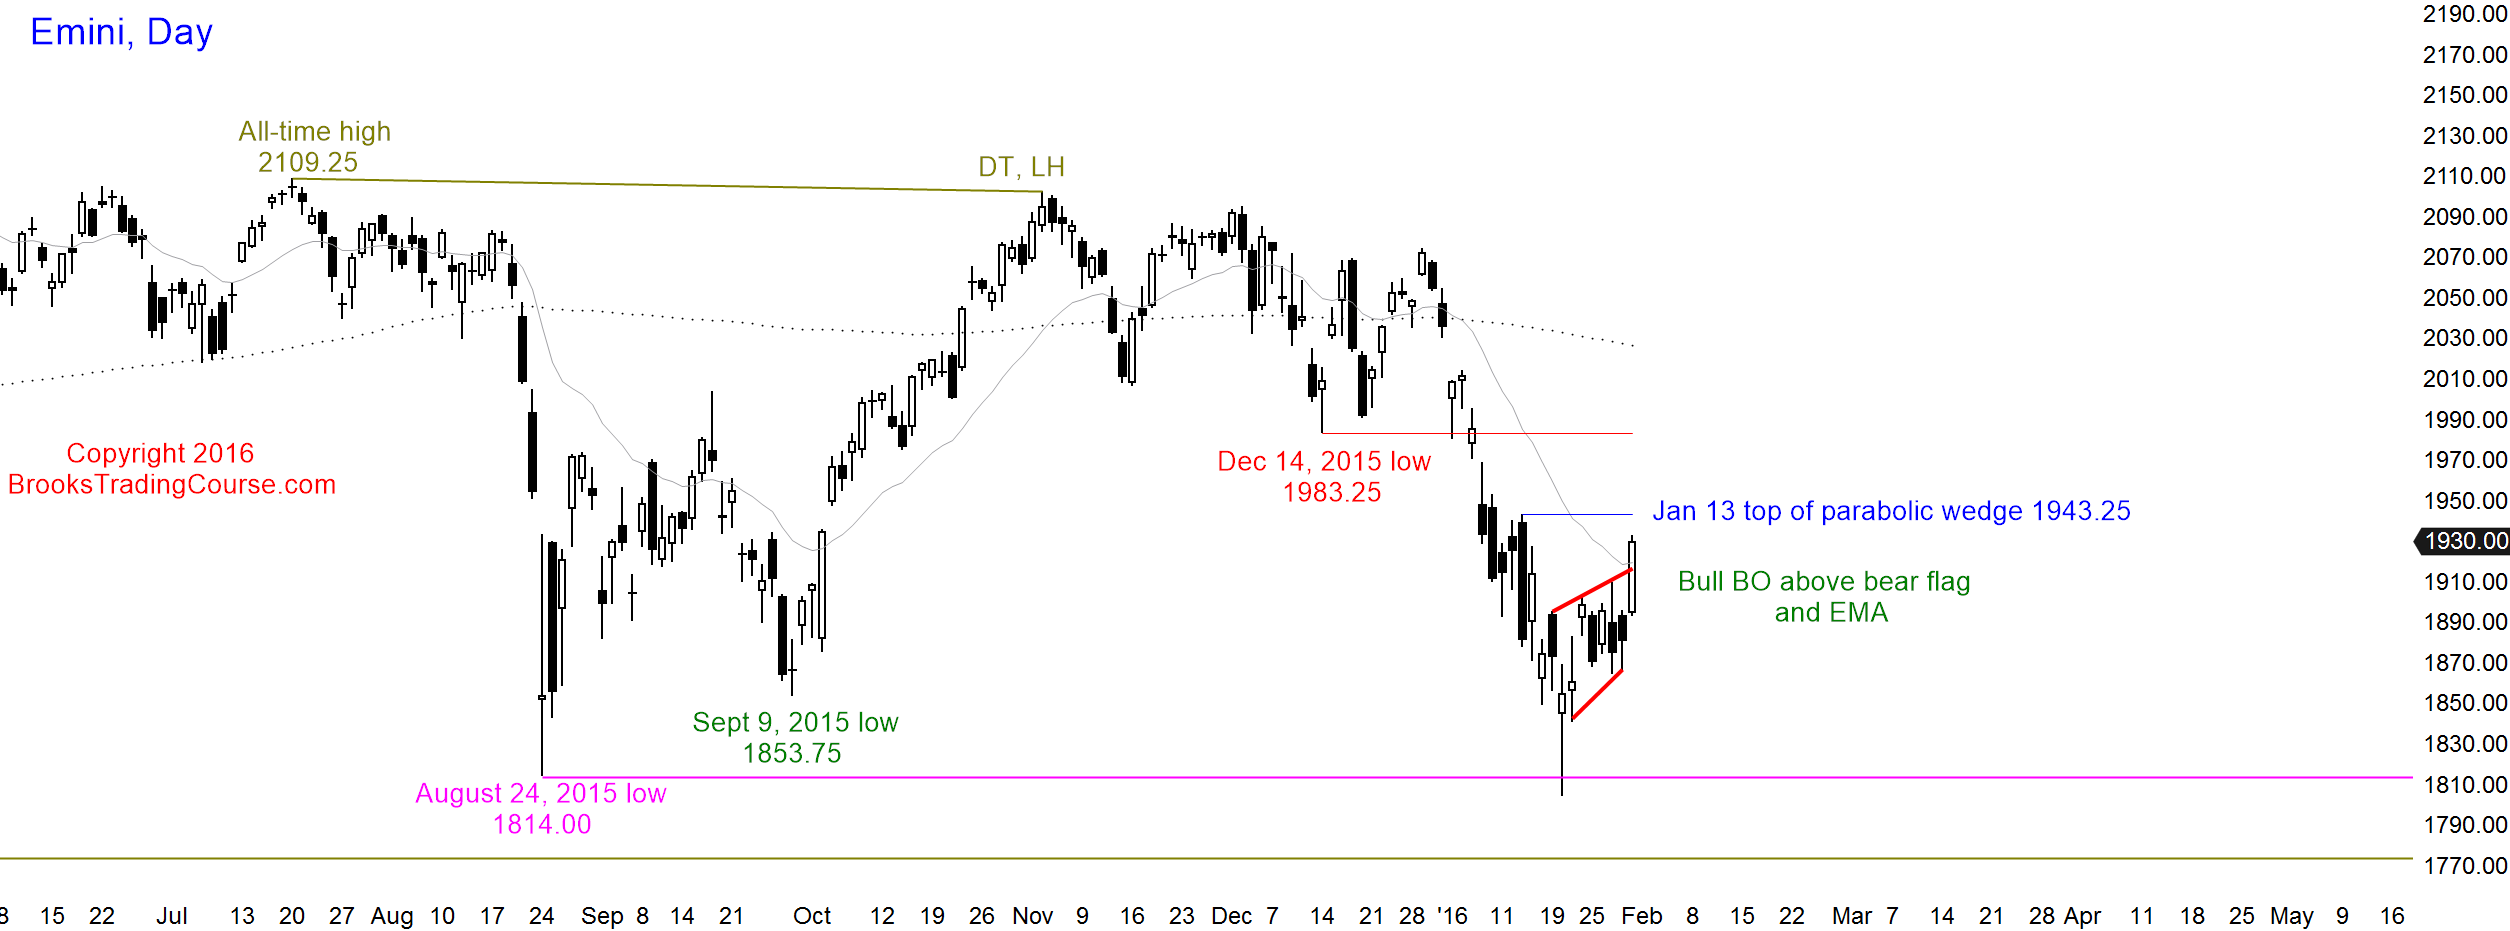
The daily S&P500 Emini futures candlestick chart’s bull breakout above a wedge bear flag and moving average was big enough to be a low probability event (a surprise). Low probability rallies trap bulls out and scale-in bears in. Both are hoping for a test down so that they can buy. The bulls who missed the breakout want to buy to get long. The bears who sold the breakout and scaled in higher now believe they are trapped into a losing trade. They want a test down so that they can buy back their shorts with a smaller loss. When both bulls and bears want to buy a pullback, the odds are that the breakout will have at least a small 2nd leg up after its 1st pullback. Less likely, this week’s breakout will reverse down within the next 3 weeks and the Head and Shoulders Top candlestick pattern might then unfold.
A second leg up means just that. It might be followed by other legs ups, but two legs up is the minimum goal, and traders will hesitate to sell until it has been reached. The odds are that the Emini will be sideways to up for at least another week. Once it is in the resistance areas, bears will begin to sell more aggressively and bulls will be much faster to take profits. This can result in another leg down. If the Emini breaks strongly below the Head and Shoulders Top’s neck line, it could work its way down to the monthly targets below 1700. The minimum target for the bulls is the top of the parabolic wedge, which was the January 13 high of 1943.25. It might get all of the way back to the December 13 low of 1983.25, which is the bottom of the 2015 trading range. Since the entire chart is still a big trading range and trading ranges usually break above resistance (like that low) before turning back down, and below support (like the August low) before turning, there is at least a 40% chance that the rally will get above that low before the next leg down begins.
During the free fall of early January, I wrote in the weekend update, “I have repeatedly written for over a year that there was an 80% chance that the upside was going to be limited until after a correction of at least 10 bars (months) and at least 10 – 20% because of how unusually overbought the monthly chart was. The correction has lasted at least 10 bars (months) and it has had 2 legs. This is enough so that the bulls, who have refused to buy over the past year because of the buy climax and the inherent risk of a deep correction, are now becoming willing to buy. If they can strongly reverse the Emini back up over the next couple of weeks, they will have taken control back from the bears and the Emini will again be balanced.”
I also wrote, “Until there is a strong breakout either way, with good follow-through, the odds are that each of these strong legs up and down will continue to fail, per my 80% rule (80% of breakout attempts fail in trading ranges, and 80% of reversal attempts fail in trends).” This is still true. Traders will be unwilling to hold onto long or short positions until there is a strong breakout up or down. Until then, they BLSHS (Buy Low, Sell High, Scalp). Scalping on the daily chart simply means taking a fast money trade where a trader looks for a 1 – 5 bar trade. This is similar to a scalp on the 5 minute chart where a trader usually exits within about 5 bars.
See the weekly update for a discussion of the price action on the weekly candlestick chart and for what to expect going into next week.


