Monthly S&P500 Emini futures candlestick chart: Failed breakout
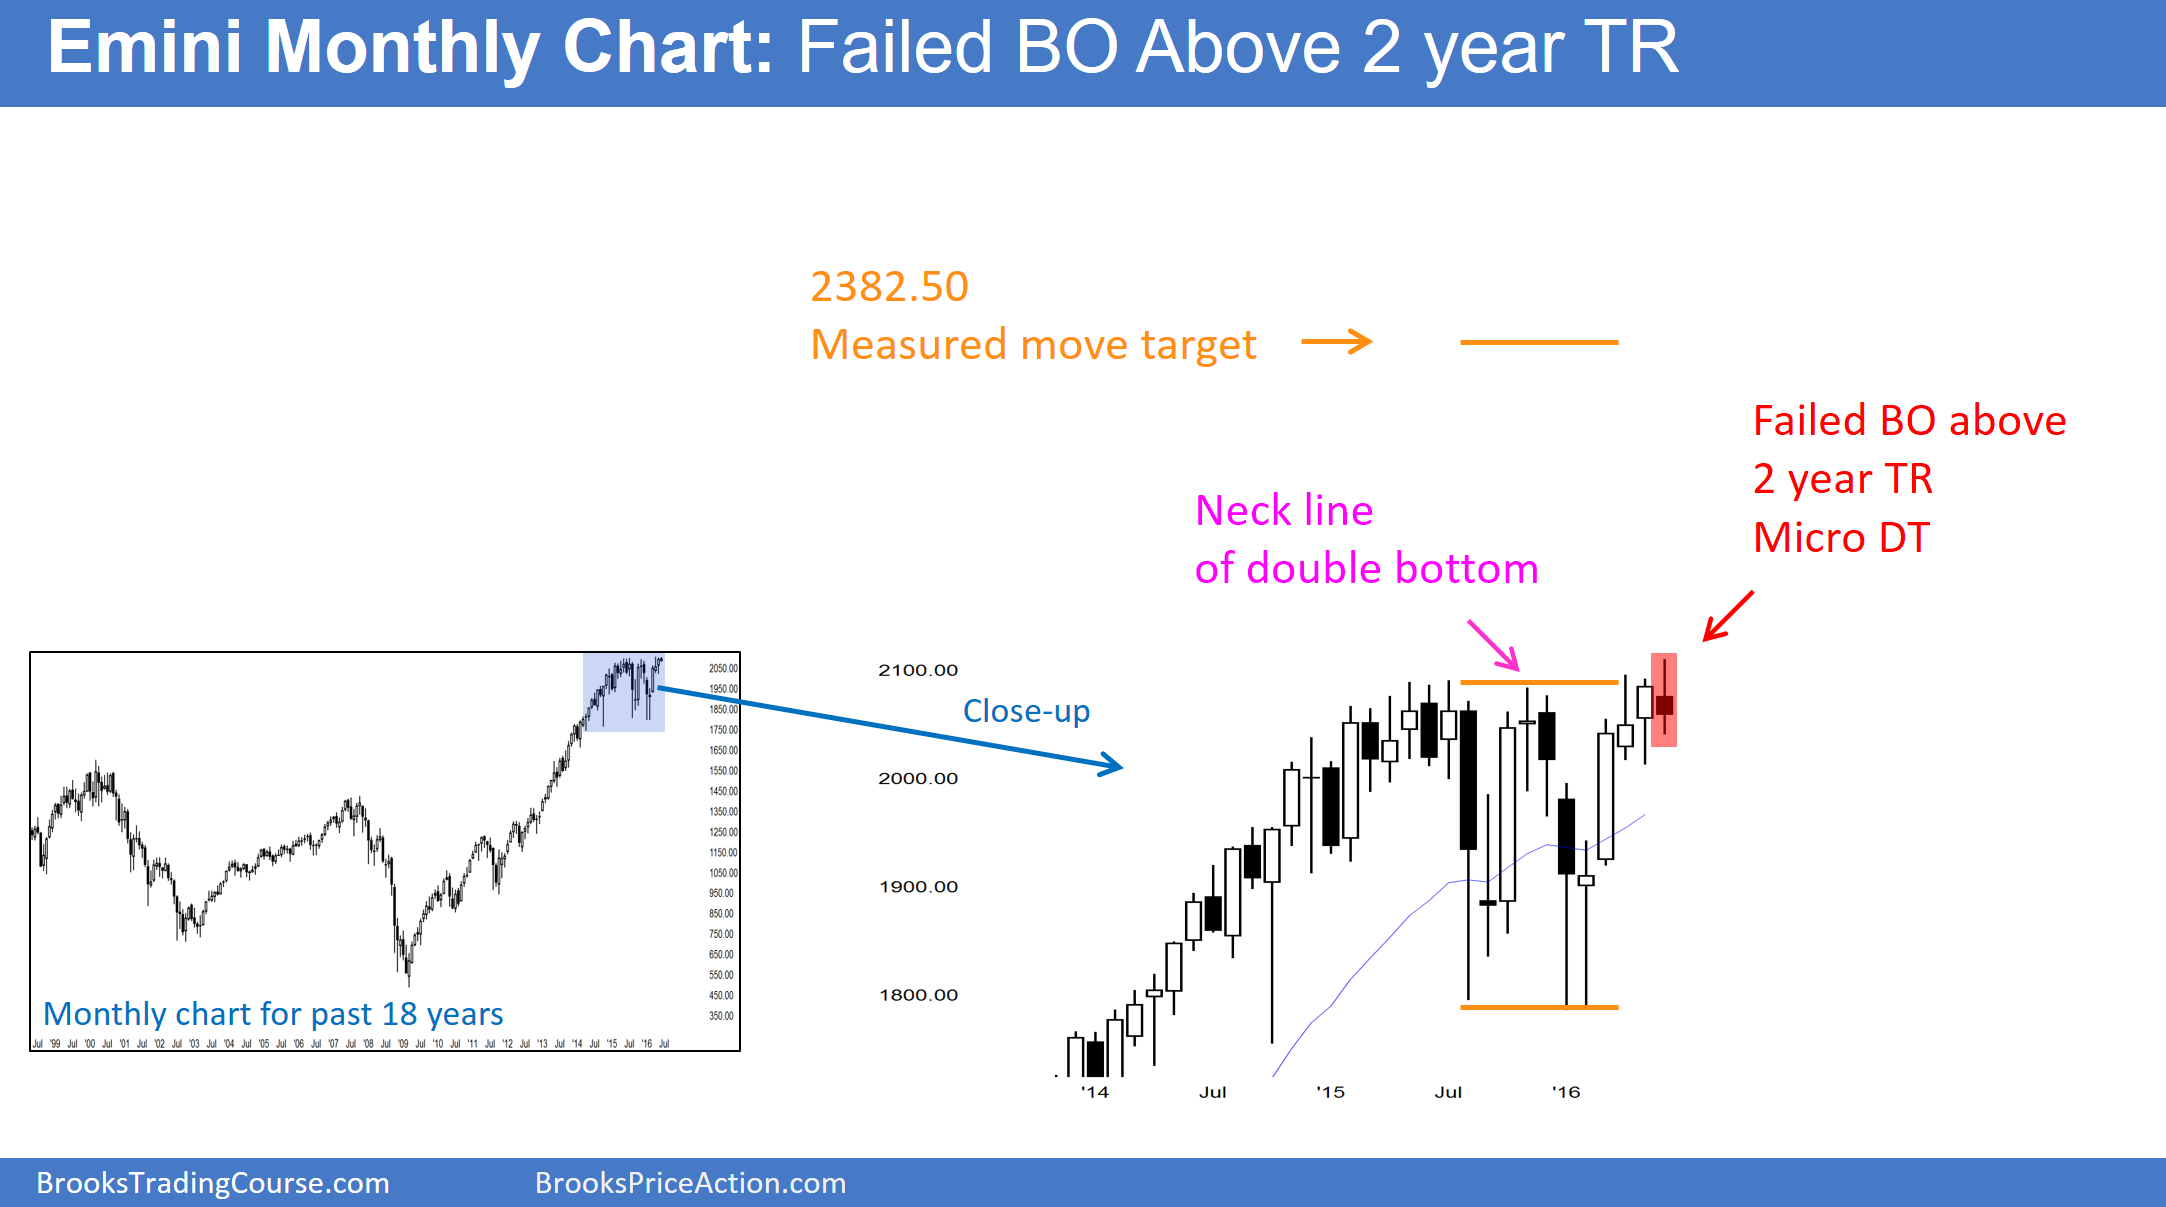
The monthly S&P500 Emini futures candlestick chart has a micro double top with the April high at the all-time high. Furthermore, it is a failed breakout above a 2 year trading range. So far, the bar is a small doji candlestick pattern. This is therefore both a weak bull breakout and a weak sell signal bar. The month might look very different when the bar closes in 2 weeks. The most noteworthy thing is that the breakout to a new high has not yet resulted in a big bull bar. This increases the chances that June will be a sell signal bar instead of a bull breakout bar.
Weekly S&P500 Emini futures candlestick chart: Trading range after buy climax
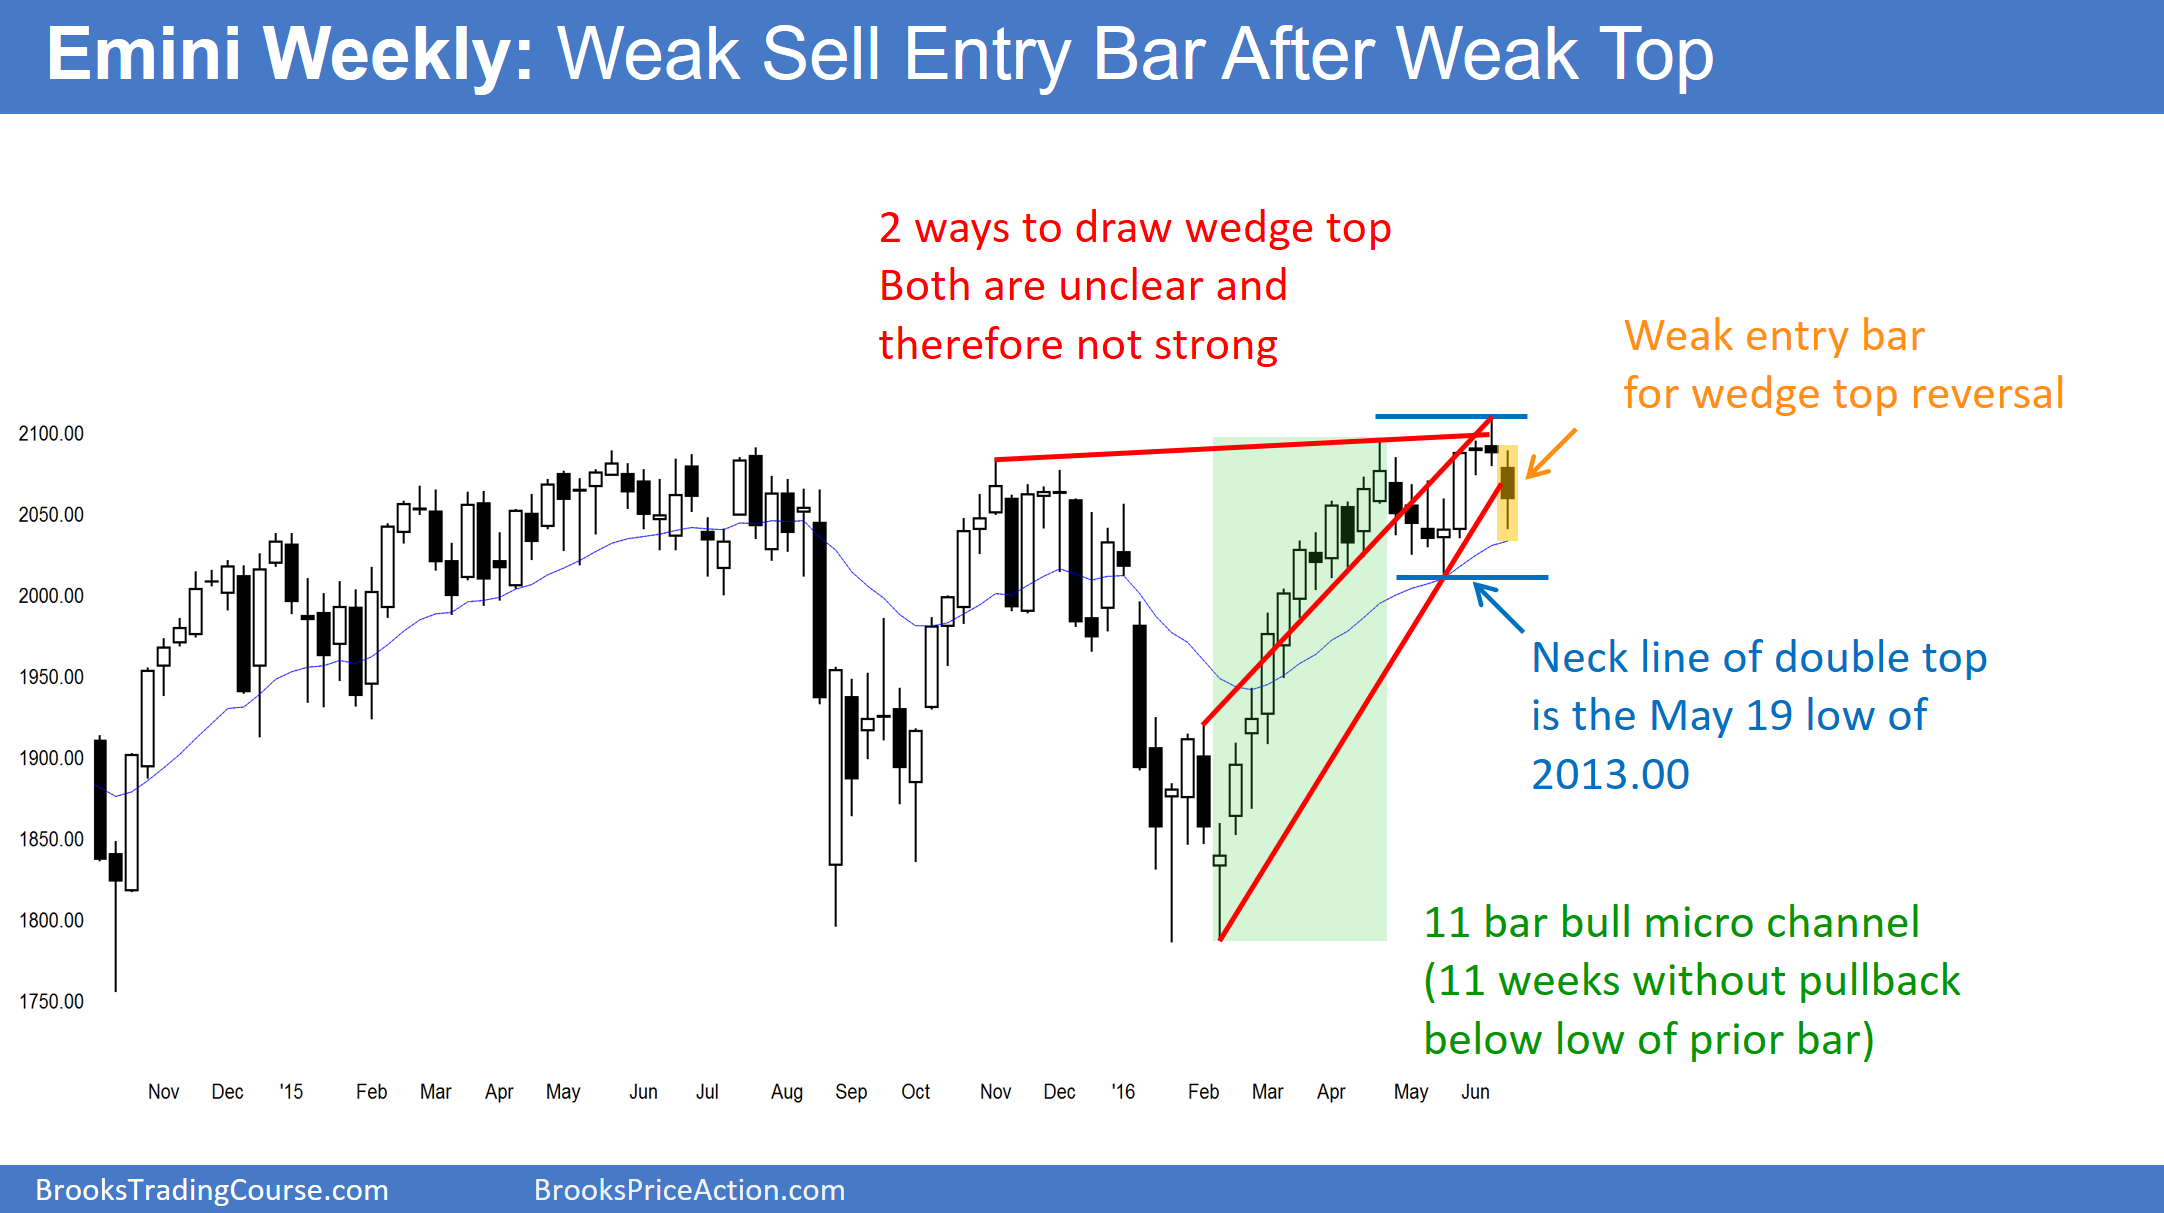
The weekly S&P500 Emini futures candlestick chart had an 11 week bull micro channel that ended on April 22. It has created the expected trading range. While this week’s candlestick pattern is a bear trend bar, the bar closed in its middle. In addition, it closed in the middle of the 3 month trading range. This is what was likely to happen following an 11 week buy climax. The Emini will still probably test the May low before it gets back to the all-time high. However, this week’s candlestick pattern is neutral. Therefore, next week will probably be neutral as well.
Daily S&P500 Emini futures candlestick chart: Day trading strategies in the middle of a 4 month trading range
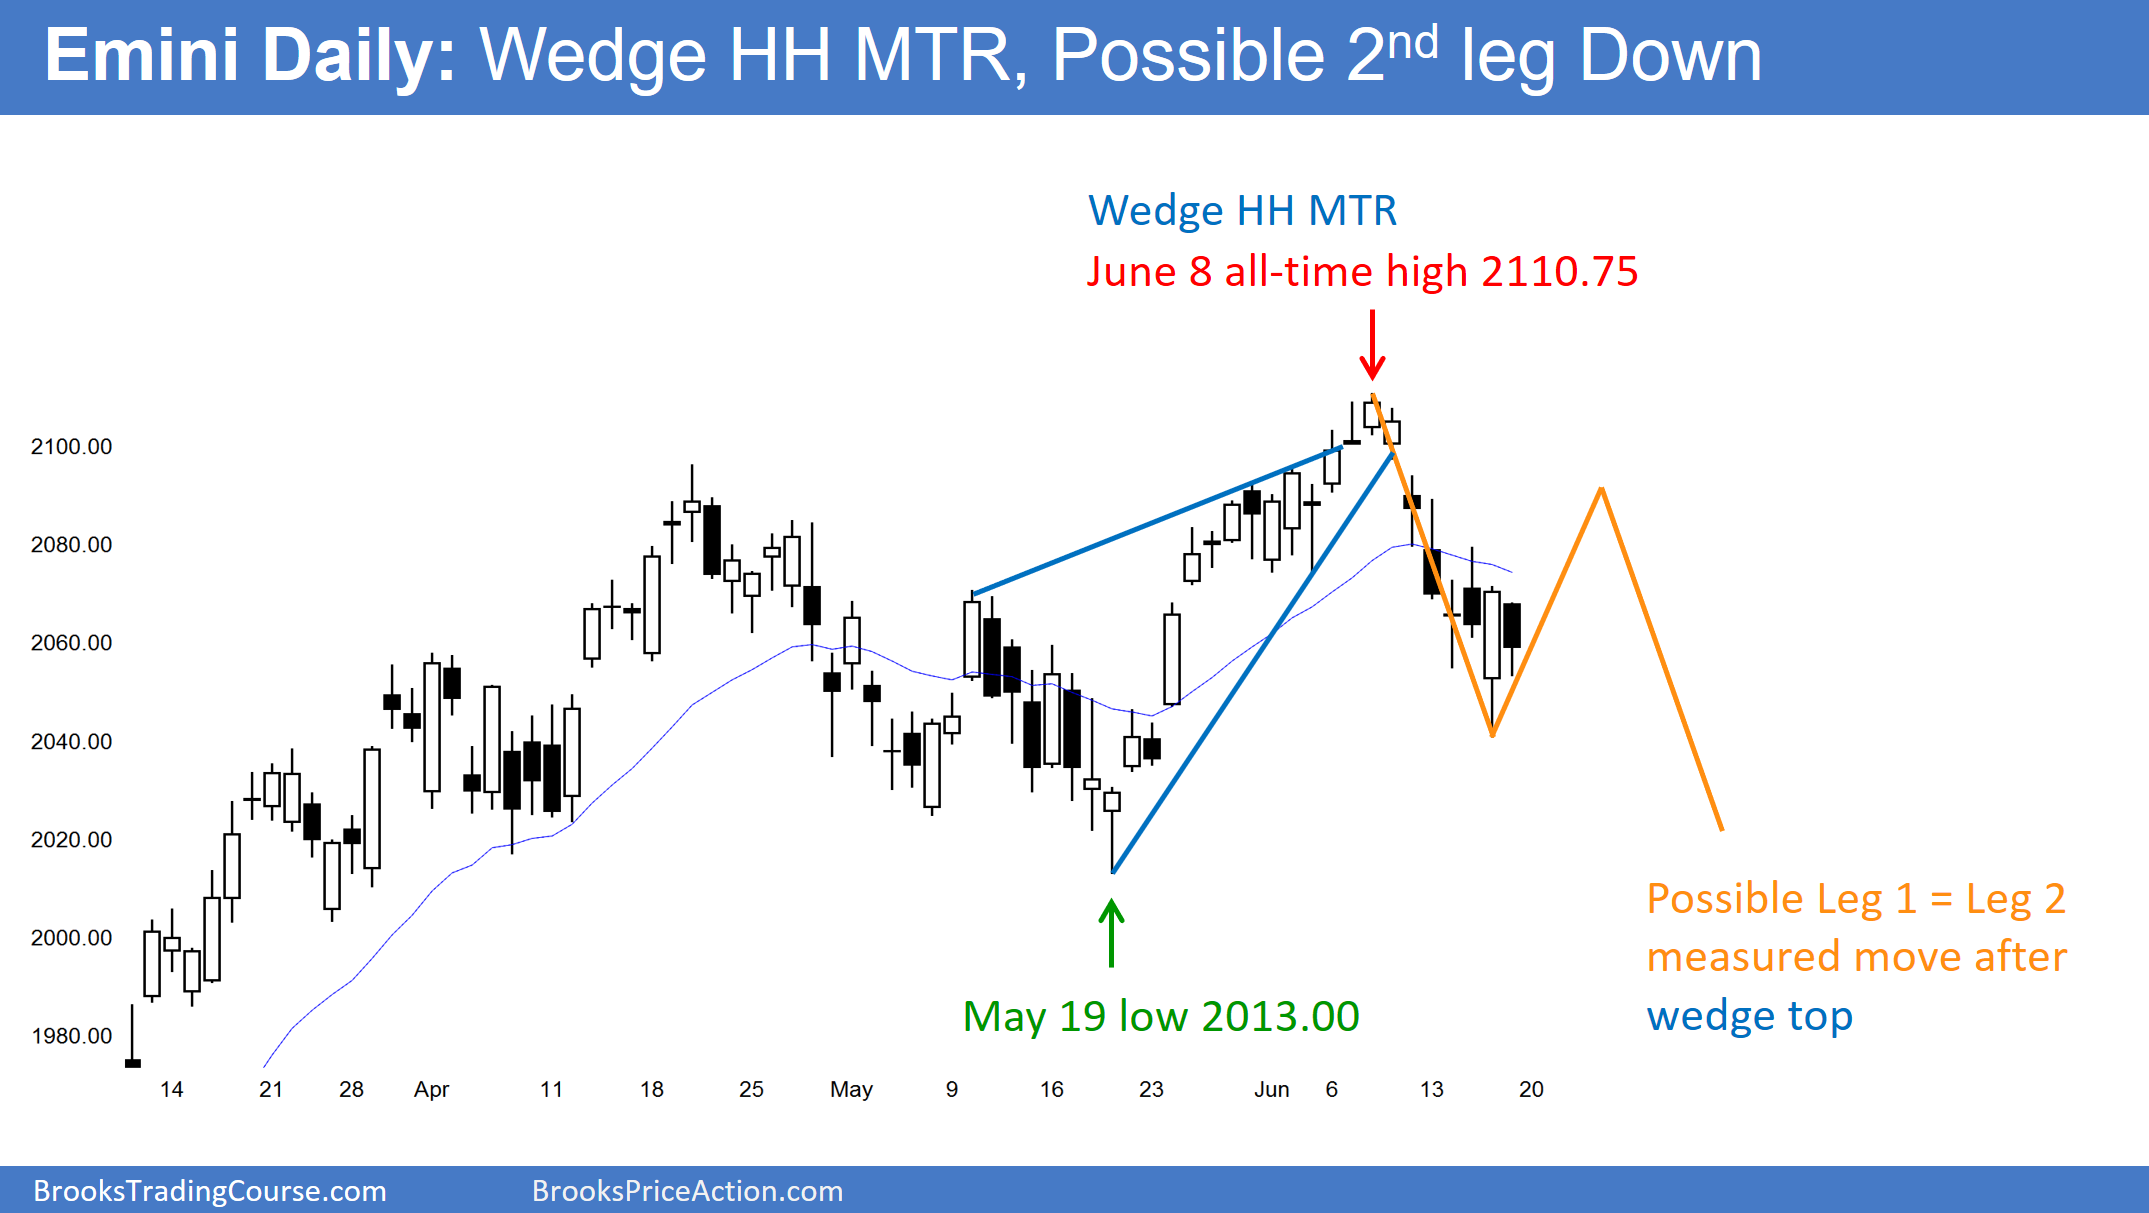
The Emini had a wedge top, which is a buy climax. Two legs down usually follow a buy climax. Although the current correction has had 2 small legs, the selloff has been in a tight bear channel. When that happens, the channel is usually the 1st of 2 larger legs sideways to down. Therefore, traders will look at any rally next week as a pullback from the first leg down. Hence, they will expect a lower high major trend reversal and a 2nd leg down. A 2nd leg down often stops at around a Leg 1 = Leg 2 measured move. Since traders do not yet know how high the bear rally will be, they not know yet where the 2nd leg will end.
The daily S&P500 Emini futures candlestick chart has been in a trading range for 4 months. As a result of the selloff of the past 2 weeks, the Emini is back in the middle of the range. Hence, it is neutral. Although Thursday was a strong buy signal bar, Friday was unable to break strongly above Thursday’s high. This inability to trigger the buy signal disappointed the bulls. Thursday’s bull reversal bar disappointed the bears.
As a result of both the bulls and bears being disappointed, the Emini is likely to go sideways next week. If there is a rally for 2 – 3 days, traders will probably sell it. Bears will sell due to their belief that the Emini will fall to the May low. Bulls will sell to take profits on scalps since they believe the Emini will fail to break above the June high.
Brexit and the U.S. markets
The most noteworthy news next week is England’s vote on Thursday to leave the EU. The Emini might stay sideways until the vote. While the news will cause a big move up or down, a move up will probably not last long. The odds still favor a test down to the bottom of the trading range.
In conclusion, there might be a rally next week, like after the Brexit news. However, the wedge top will probably have a 2nd leg down after the rally.


