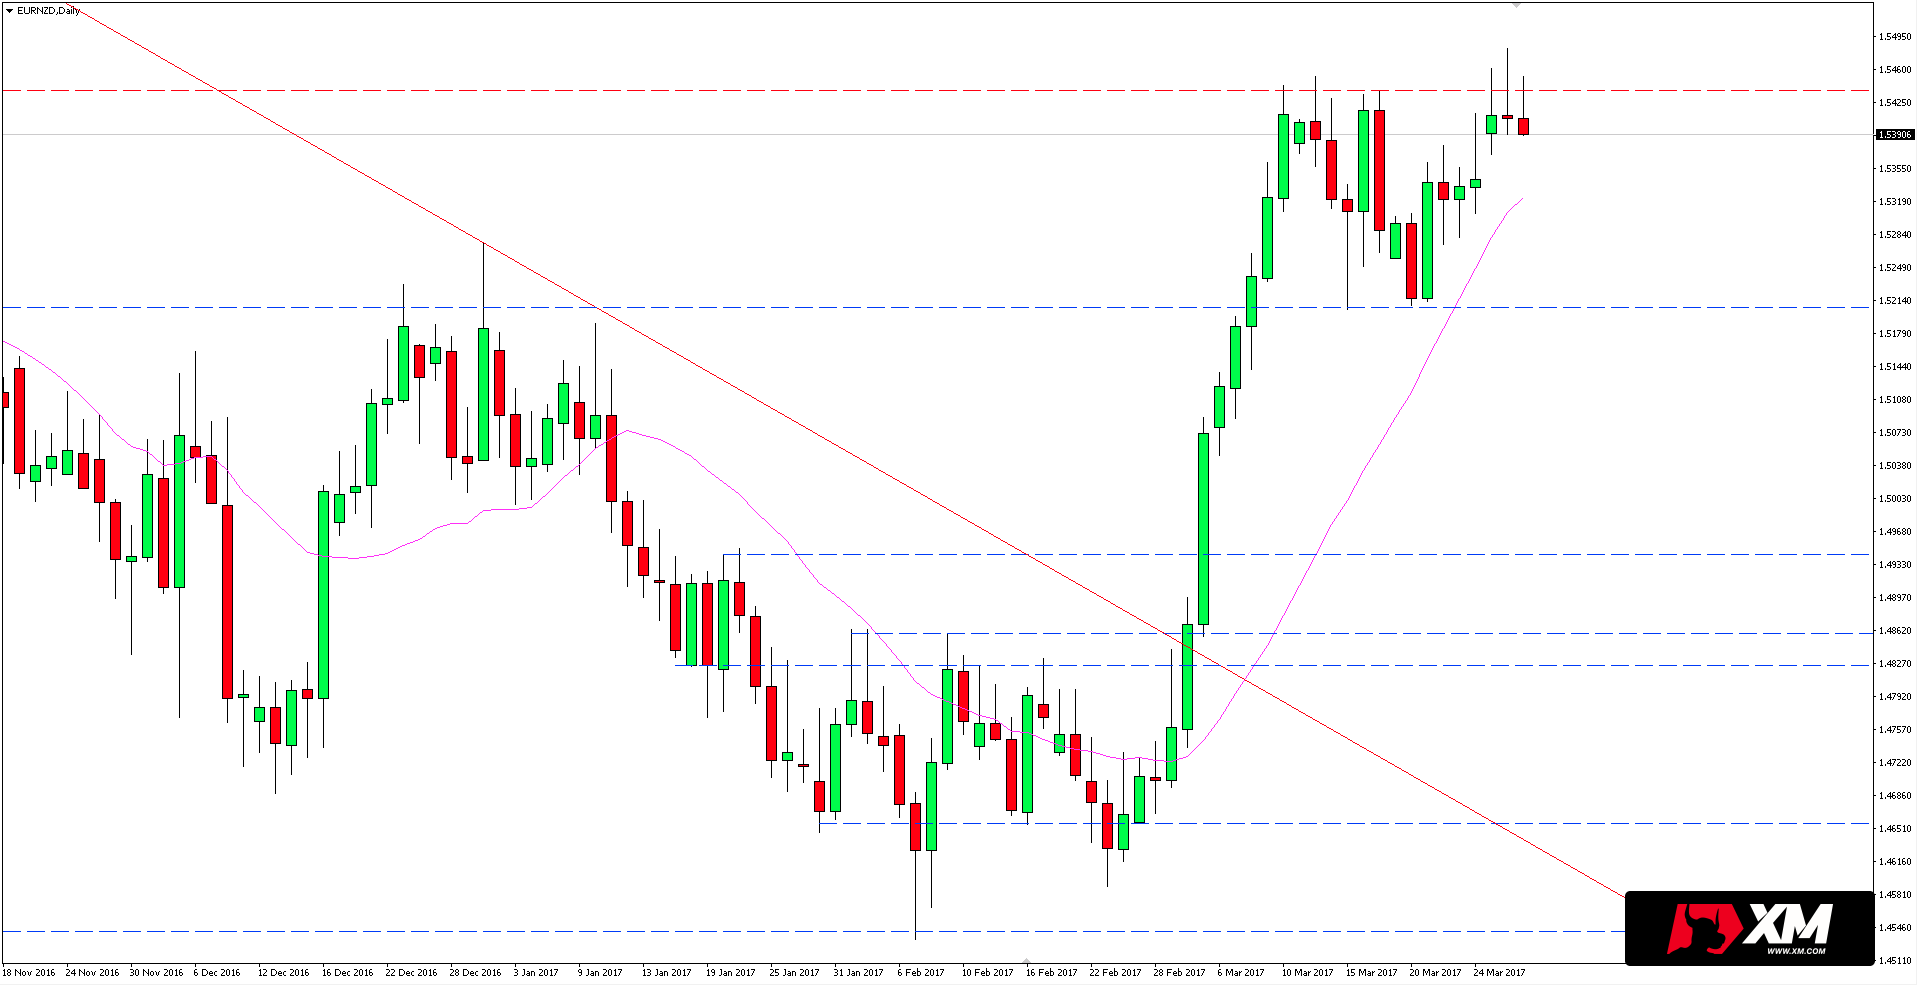
Yesterday on the daily chart of EURNZD candle with long upper wick formed which is false break of both resistance at 1.5438 and high from previous day. This type of behaviour is typical for reversion of the movement.
This scenario is confirmed also by H4 chart where we can see breaking of increasing highs and lows patterns. Price is also below 20-period SMA.
Check out XM broker and get $30 for opening account!
Continuation of decreases can lead the price to local support which can be seen on 1.5300 level. Its breaking will open road to key area 1.5210.


