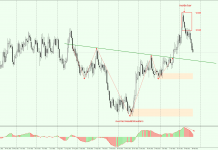
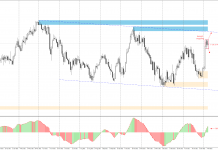
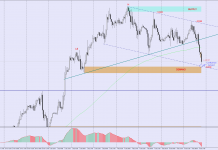
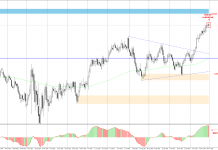
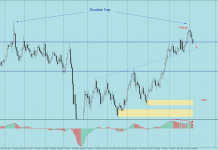
NZDCAD on the H4 chart is in a bullish trend, where lows and highs are set on higher levels. In the beginning of this month there was a chance to join this trend.
Currently price returns to bullish trend support line running from 22nd of May and maintains this dynamic trend. In addition, the trend line coincides with horizontal support area near 0.9648.
Bearing in mind the above, a continuation of the trend is more likely and rebound from the support area and attack on resistance at 0.9750 can be expected.
XM Broker guarantees protection against negative account balance and $30 on start!
However, if declines are stronger and support area fails, this will mean a potentially deeper correction where the next level of defence is seen near 0.9593.


