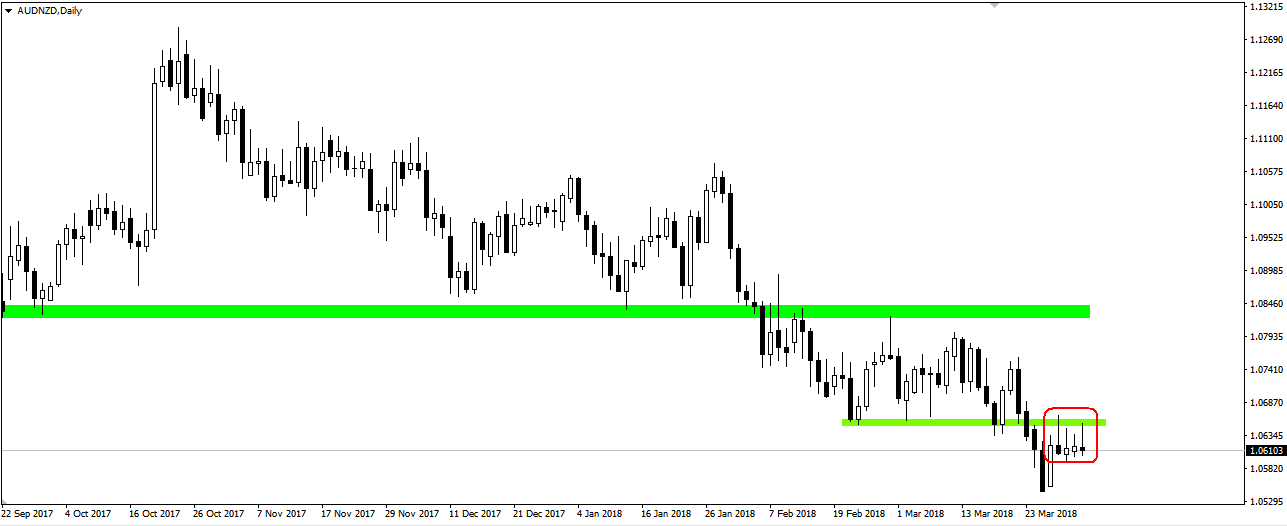
During the Easter period the AUD/NZD on daily intervals looked interestingly. Starting from March 29, each day ends with a longer upper shadow. Currently in the morning, today’s candle looks like a classic bearish pin bar. Such shape of the candle suggests declines, the more so that the trend is bearish, and the whole situation takes place just below the very readable zone of resistance. The shapes of candles suggest activity of supply when only the price comes up to 1.0650. It is possible, then, that in the end there will be a stronger downward reaction.
I trade on this instrument at broker XM, which has in its offer more than 300 other assets >>