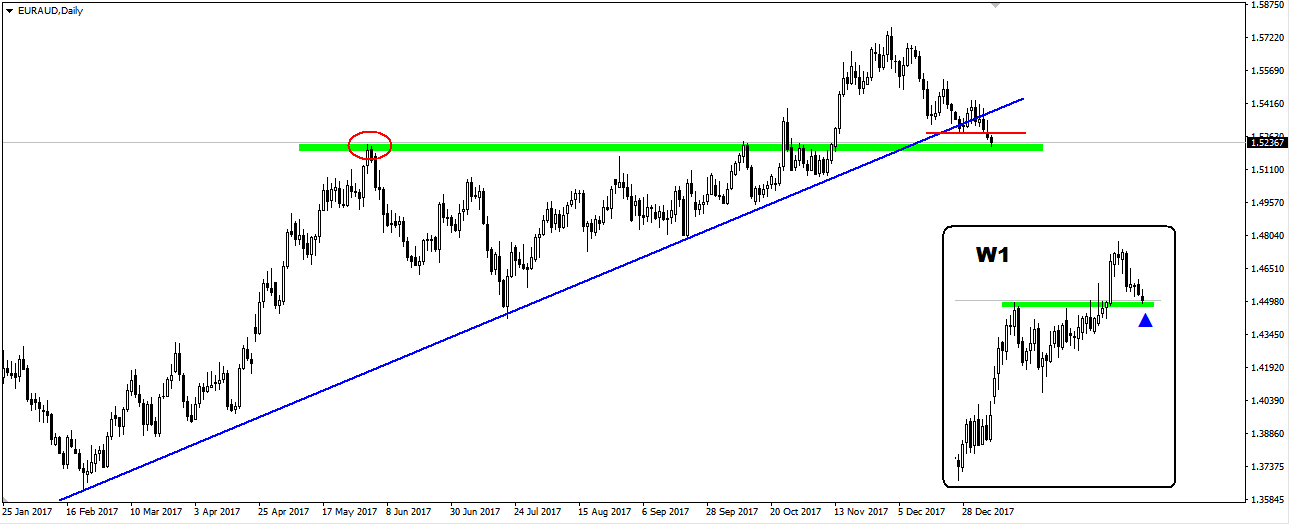
EUR/AUD looks more and more interesting, especially following the recent stronger declines in the single currency. It seems that soon there will be a solution that will manifest itself in a form of a larger, dynamic price movement. Seemingly, the daily chart looks very legible – we have a broken trend line, which for a long period of time was perfectly respected, and the price fell below the low created after breaking the trend line. Open way to declines? Theoretically yes but… it is worth noting that the dynamics of declines until now is not high, and for over a month of declines, the bears have not achieved too much. The trend line can always be corrected, and the layout of lows and highs from a slightly further perspective still remains typical for the upward trend. It is perfectly visible on the weekly chart, where we have a strong upward trend and the test of the previous high, and thus a potential place for a strong upward rebound.
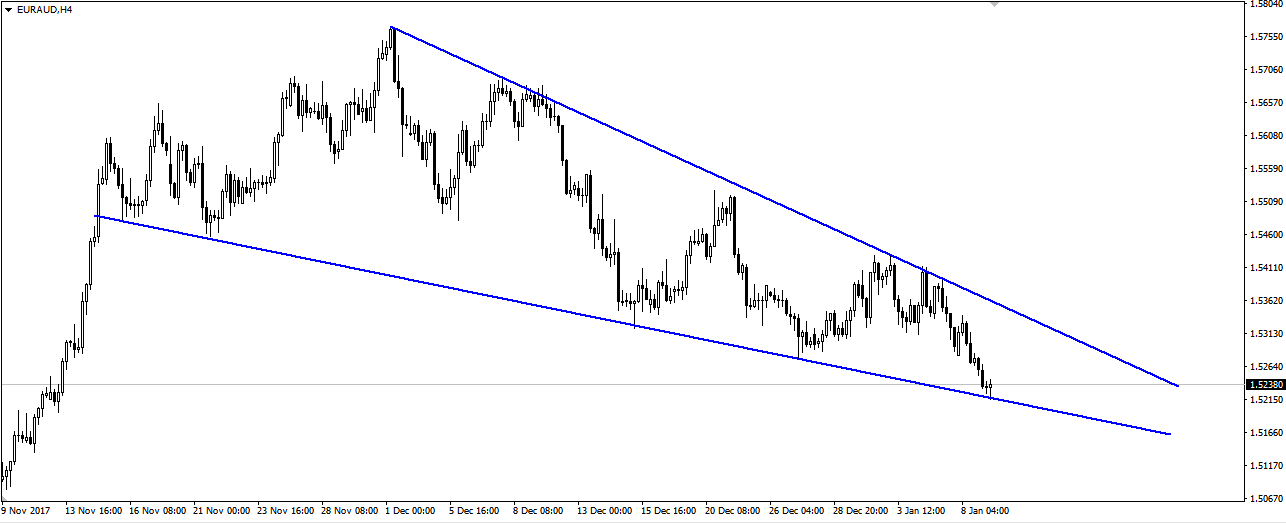
 I mentioned the small dynamics of the decreases. Chart H4 additionally shows that this dynamics is constantly decreasing. At this interval, it can be seen that the range of price fluctuations is lower and lower. Quotations fit into a formation of the lowering wedge. In the context of the upward trend that precedes it, it is a typical correctional formation. Breaking the top should, therefore, bring a strong buy signal, the more so as we are on a weekly chart on key support.
I trade on this instrument at broker XM, which has in its offer more than 300 other assets >>