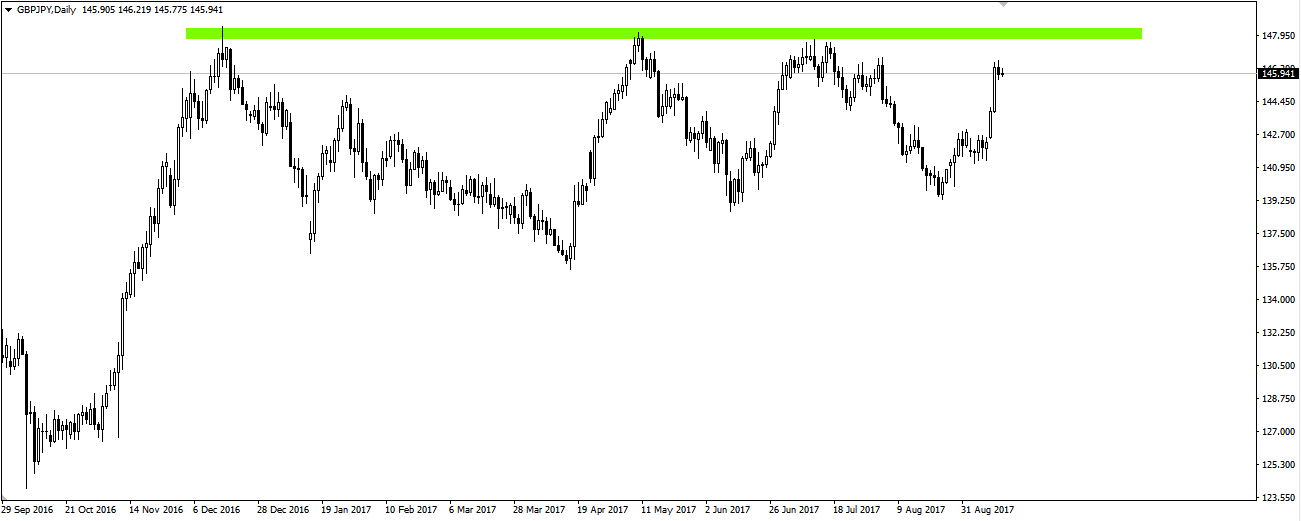
On the daily chart GBP/JPY continues a strong upward movement lasting since the beginning of August. As you can see on the chart, pair is swinging a lot recently, upward and downward movements are lasting enough time to earn on each such move. Comparing these swings, it can be said that the bullish ones are more dynamic. It seems that price for the fourth time in a row should soon test clear resistance linking the earlier highs. The current correction may thus be a chance to join the trend at a slightly lower price.
Check out the terms and conditions of trading with the XM broker
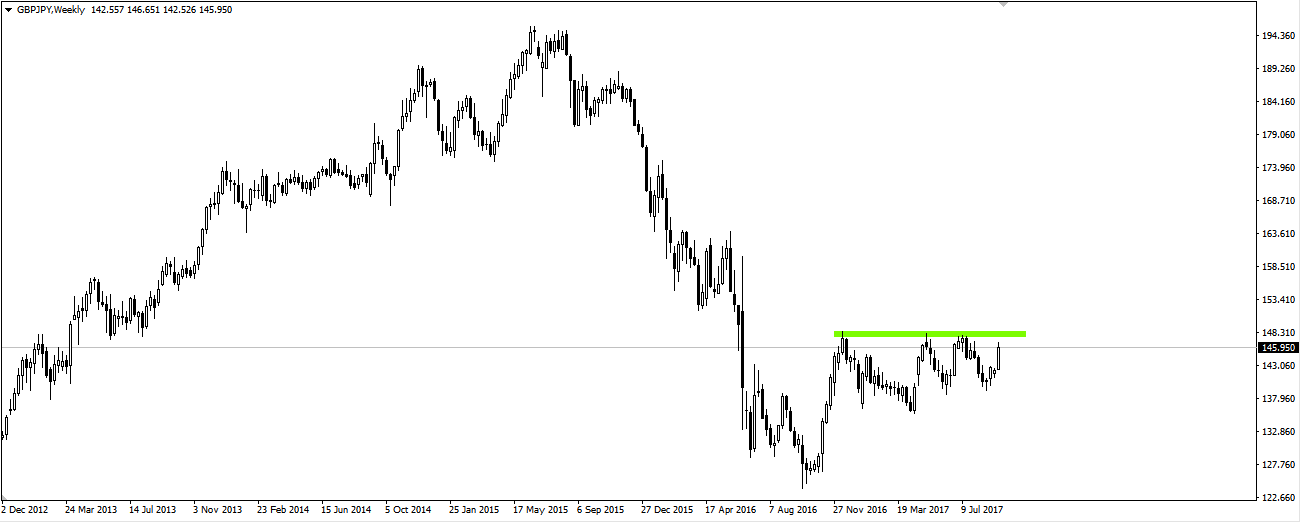
On D1 the price seems to be high, but the weekly chart shows it is not. Looking even wider for the past 20 years, the rate is still at a fairly low level. As you can see, each successive reflection of this resistance is slightly weaker. This gives us a chance to successfully break out in the next try. If this happens, it will be the first step towards changing the long-term trend.