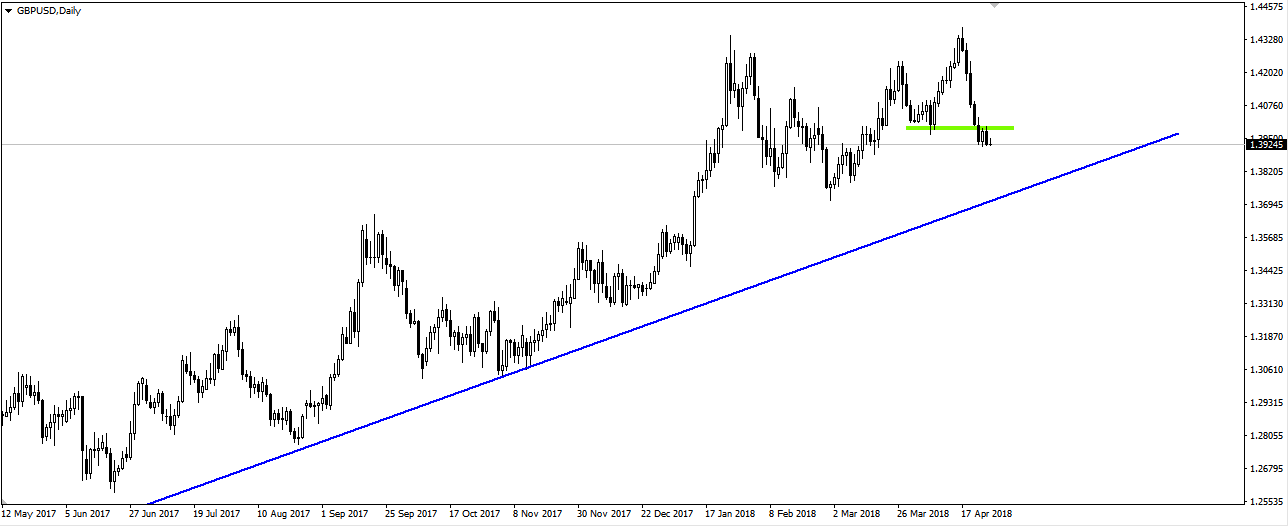
GBP/USD pair is starting to move to new lows of the very dynamic downward movement since April 17. The daily chart shows that the price is below the level of the previous low and there was a slight correction under this resistance. If the declines are continued, the supply will have a large space to move. The next minimum is quite low, also the over a yearly trend line is located at a significant distance from the current price.
I trade on this instrument at broker XM, which has in its offer more than 300 other assets >>
 Even more interesting is when we look at the chart on a monthly basis. It turns out that the current upward movement has reached the legible resistance zone based on previous lows. As you can see, the two previous upward movements had almost the same range. Interestingly, not only the peaks of marked corrections but in fact, all the peaks of the last 10 years were formed between May and July. It can be concluded that the technique and statistics favour the development of a larger downward correction.


