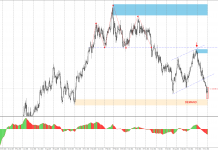
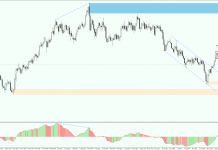
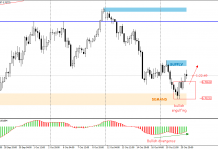
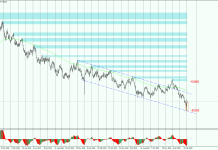
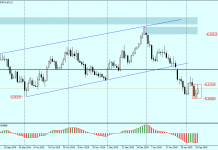
On AUDUSD chart we notice growing demand pressure. Price tested psychological level of 0.7550. Probably price will soon set new higher highs on the chart. Resistance is around the 0.7650. It is worth looking at chart with a lower time interval.
 Get access to around 200 financial instruments through Noble Markets >>
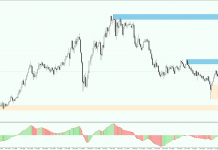
On H1 chart, there is a strong growth impulse that tends toward 0.7600. You can see a series of bull candles and no activity from supply side. Test of previously mentioned area will likely lead to a correction. It should be noted that after such a strong impulse corrections in most cases are shallow and short-lived. Breaking the aforementioned resistance will open way to further growth.


