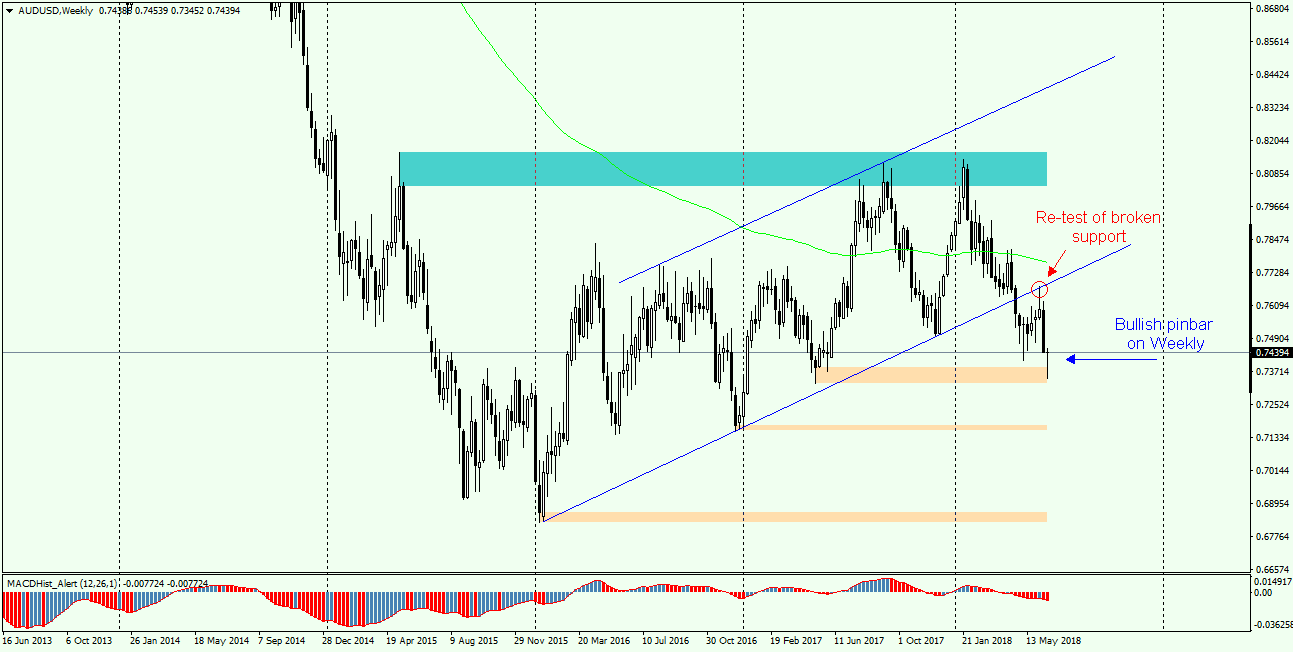
AUDUSD is moving in a downward trend since July 1, 2011, when the pair reached the ATH at 1.1080. Over the next 4.5 years, there were occasional upward adjustments, which were stopped by supply and declines were continued up to a minimum of 0.6830, which was established in 01.01.2016. From this day, an upward correction began, which took the form of a growth channel (flag), from which pair broke out in April this year and at the beginning of June, we observed a re-test of the defeated support of the channel. The last session of the last week was definitely bullish and a bullish pinbar was created on the weekly chart.
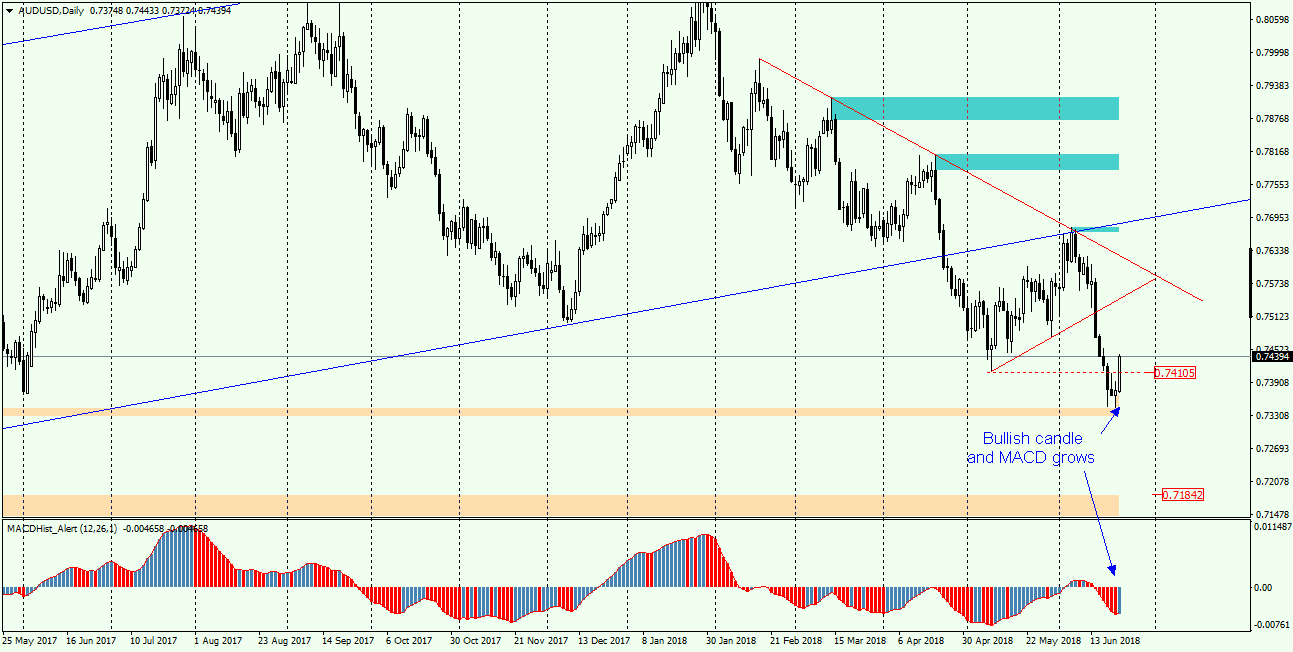
On the daily chart, we notice that Friday’s upward daily candle is accompanied by a change on MACD which starts to grow. A similar situation also appeared on GBPUSD, which I described in the analysis of 22.06. In addition, between the price graph and the MACD oscillator, there is a divergence indicating growth. There are met 3 conditions of the PA+MACD strategy … hence the conclusion that further increases are very likely. However, it should be remembered that the long-term trend is definitely bearish, so the nearest increases should be treated as a correction that may end at the next resistance, which may be the marked in red local trend lines.
Looking for a buy opportunity, it is worth paying attention to the level of 0.7410, from which in May started the 250 pips bullish correction.