Bitcoin price remained around $450 for weeks, but over the weekend it fell by almost $100. According to the Bitstamp valuation, BTC was moving in the vicinity of $352. Now the price is stabilizing around $380 – round level of $400 will work as a significant resistance on all TFs described below.
“BTC is a failure”
The reason for the sudden downturn in prices was the decision by Mike Hearn – on of the main developers behind cryptocurrencies projects. He resigned from further development of everything related with Bitcoin, sold off his wallet and described Bticoin as “failure” and “failed experiment”.
Below you can find present technical situation on the monthly, weekly, daily and H4 charts.
BTC/USD monthly
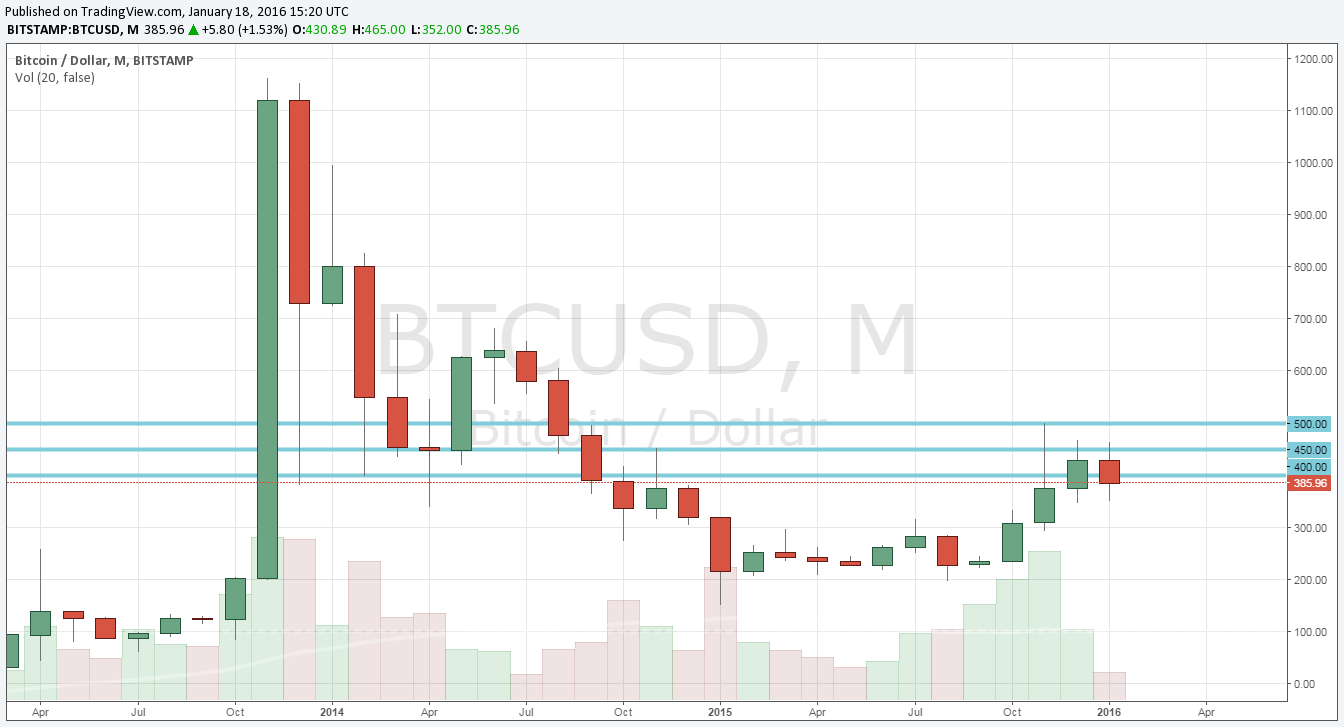
January candle has changed its color to red (downward) since the last week analysis. All thanks to the events described above. Its minimum however, did not exceed the December lows and it is very possible that by the end of the month the southern wick of the candle will become much longer (repurchase of the dynamic drops).
BTC/USD W1
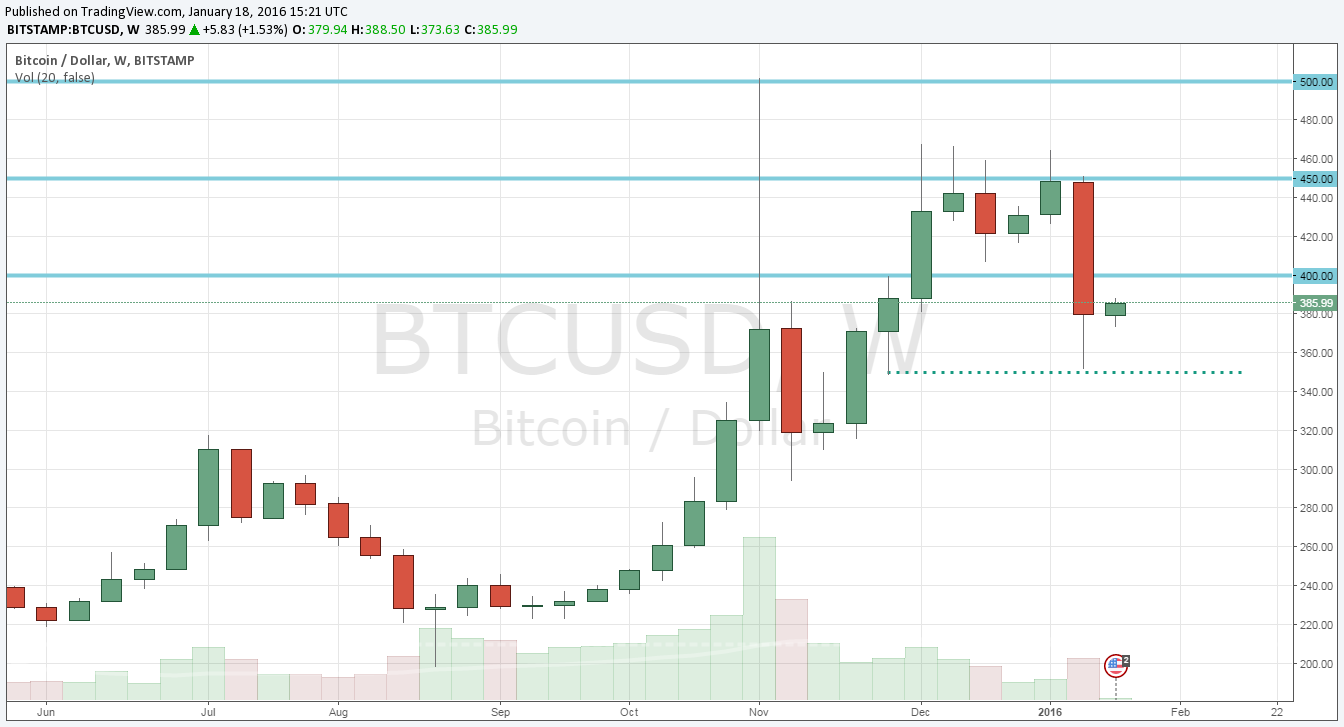
Weekly chart clearly shows that after 5 weeks of unsuccessful struggle with resistance at 450.00, price rapidly declined by almost $100. Round 350.00USD level (minimum of the last November candle) slowed the further declines and the new week opened at the height of the last week’s low. The price will fight with resistance at 400.00USD – on the lower TFs the situation is similar.
BTC/USD D1

Zone, which brought the December BTC/USD increase also blocked the January declines. After a very long supply candle – which easily broke below 400.00 – we saw immediate reaction of buyers near 350-360 support zone. Price will try now to test the resistance from below. In the meantime however, it must also deal with local price cap around 390.00
BTC/USD H4
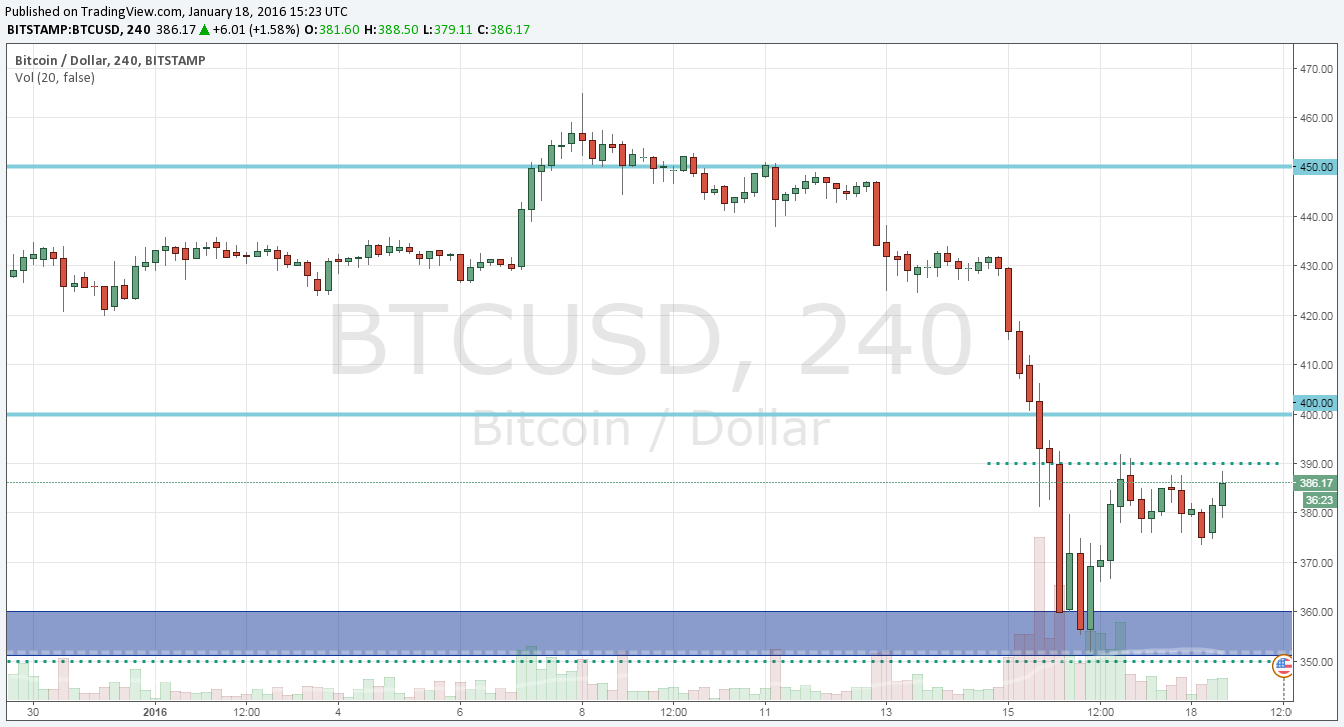
H4 chart how the local resistance (390.00) much better. 390.00-400.00 resistance zone should be used for short trades that follow intraday bearish momentum. However, if the zone breaks, investor will look for purchase patterns and hope for return to 450.00.


