Like yesterday, today began with a trend from the open bull trend, and like yesterday, it stalled after a few bars. The initial bull breakout can lead to a measured move up or down. If the move does not begin for 10 or more bars, the initial rally will lose influence and the Emini will enter breakout mode, with a 50% chance of a swing up or down.
Despite the initial rally, the stall at yesterday’s low and the 4 dojis in the past 5 days on the daily chart increase the chances of a lot of trading range price action today. If the Emini falls to a new low, bulls will try to reverse it back up from a measured move down. The measured move down might be from the high to the open or low. The bears instead hope that a break below the low will lead to a bear trend day. The bears need either a strong bear breakout or a tight channel bear. Without either, traders will see any selloff as a bear leg in a trading range.
At the moment, the Emini is Always In Long, but it is in a trading range. The bulls need either a strong bull breakout or a small pullback bull trend. Without either, the rally will probably last 1 – 3 hours and be followed by a swing down, creating a trading range day.
Pre-Open Market Analysis
S&P 500 Emini: Learn how to trade a catalyst
The Emini had a pullback yesterday from last week’s rally. Four of the past 5 days were dojis. This is trading range behavior and it is just below the resistance of the November high. For several weeks, I have been saying that a trading range on the daily chart was more likely than a continued rally above the all-time high, and this is what is unfolding. The Emini sold off last night on the news from Turkey and Russia. This will give day traders a chance to earn how to trade a catalyst. However, the Emini had already stalled, and if you read my weekend blog, you will see that I thought we would pull back this week, and that the Emini might be forming a trading range between 2000 and 2100. There is always a news event happening every minute of every day. It is convenient to claim that the news caused the event. However, the 15 minute chart yesterday had 15 consecutive bars without a bull body, so the selloff began before the news. People are naturally drawn to easily understandable explanations. Yes, the news caused the selloff, but I did not anticipate this news, yet said that a pullback was coming. This means that there are additional forces at work.
All markets constantly probe up and down to find the best price for bulls and bears to trade, and they do it on all time frames. That price changes constantly with every little piece of information from every company and every government and every world event. This makes the perfect price impossible to know. Because the fairest price can never be known, the market needs an alternative.
The alternative is that it constantly probes up and down to find a range that will encourage both bulls and bears to trade. Although the exact perfect price cannot be known, the market is very good at knowing how high is too high and how low is too low. The market usually goes one way until traders decide that it is too far. It then probes in the opposite direction. Sometimes the range of fair prices can be very broad, like it has been for the past year. Other times, it is very tight, like it was during the 1st 7 months of the year. The 20 point last night was a probe down on the 5 minute chart after last week’s probe up. For the past year, the market has consistently decided that the 2100 area is too high. There are too many bears eager to sell there and not enough bulls willing to buy. The result is that the Emini keeps turning down.
At some point, one of two things will happen. The bulls will conclude that there are simply not enough bulls willing to buy around 2100, and that they should instead sell out of their longs and wait to see how far down the bears are willing to sell. Once they sense that the market has gone down too far, they will buy again. The 1800 area has been too far down for over a year, and it might be again if the Emini sells back down there. It is too early to know.
The other thing that can happen at resistance is that the bulls continue to buy and the bears see that they are becoming unable to drive the market down very far. If enough bears decide that there are not enough sellers around 2100, the Emini will have to go higher to find more sellers to take the other side of the trade from the buyers. The result would be a breakout above the 2100 area. The bears would wait to see if the bulls are quick to take profits or are eager to buy above the range. If there is a strong breakout, the bears will wait until there are signs that the rally is getting exhausted and that it has gone too far. At that point, they will begin to sell again.
The Globex market is currently down 14 points. The bear breakout on the 60 minute chart has already led to about a measured move down from the two day trading range. The 240 minute chart formed a wedge rally over the past week. A TBTL Ten Bar Two Leg correction was a reasonable goal. This overnight selloff has met that goal. Traders learning how to trade the markets should realize that the Emini could easily continue down to last week’s low and then to the bottom of the yearlong trading range. Those who trade the markets for a living know that once the minimum pullback goal has been reached, bears might take profits and bulls might begin to buy again. If the Emini reverses up, bulls will look for a swing trade, and then a test of the November and all-time highs.
Next Monday is the last day of the month. What happens until then determines the appearance of the monthly chart. So far, this month has been a doji candlestick pattern. This is neutral, and it is bad follow-through buying after the October rally.
Last night’s selloff was followed by about a 50% pullback. The Emini has since sold off again to near the overnight low. The selloff was strong enough to lead to a test of last week’s low around 2000 over the next week or two. However, the bulls will try to create a double bottom on the 5 minute Globex chart. Day traders will watch the open. There will probably be a big gap down. This increases the chances of a trend day up or down. When there is a big gap, there is about a 50% chance of a trend up or down on the open. The Emini also has a 50% chance of limited move over the 1st hour or so until it gets closer to the moving average. At that point, it then decides between a reversal up and trend resumption down.
Forex: Best trading strategies
The daily chart of the EURUSD formed a small wedge bottom over the past 2 weeks, and it is currently trading above yesterday’s small reversal bar. Yes, the news from Russia and Turkey will affect all markets. However, the wedge bottom was forming long before last night’s news, and I posted yesterday that a 150 pip rally was likely this week. Nothing has changed. There is a 60% chance of about a 150 pip rally beginning today or tomorrow. The swing up could reach the October 28 top of the 240 minute bear channel at around 1.1100.
The bears want the 240 minute chart’s bear channel to continue down to the April low, and it might. The consecutive sell climaxes and the buying at each new low make it more likely that there will be a swing up soon. Besides 1.0800, the minimum target is TBTL Ten Bars Two Legs sideways to up on the 240 minute chart, which is what happens about 60% of the time after a wedge bottom.
The 60 minute chart has not yet had a strong bear breakout, and the bears see the two day rally as a bear flag. The context is good for the bulls. When there is not clear bottom, there then is often a bull breakout above the bear flag, and then a measured move up. The bear flag is now about 70 pips tall. If the bulls get their breakout today or tomorrow, the 1.0800 target would be within reach.
Momentum favors the bears on the daily chart, but probability is beginning to favor the bulls on the 240 and 60 minute charts. Although the weak rally over the past 2 days means that the bulls are still mostly scalping, if there is a strong bull breakout, they will become more willing to hold for a swing up. Day traders will be watching for a bull breakout. If there is another leg down to a new low, bulls will buy the new low, just as they have done for the last several new lows on the 240 minute chart. When bulls consistently make money in a bear trend, the bear trend usually is transitioning into a trading range.
Summary of today’s S&P Emini futures price action and what to expect tomorrow
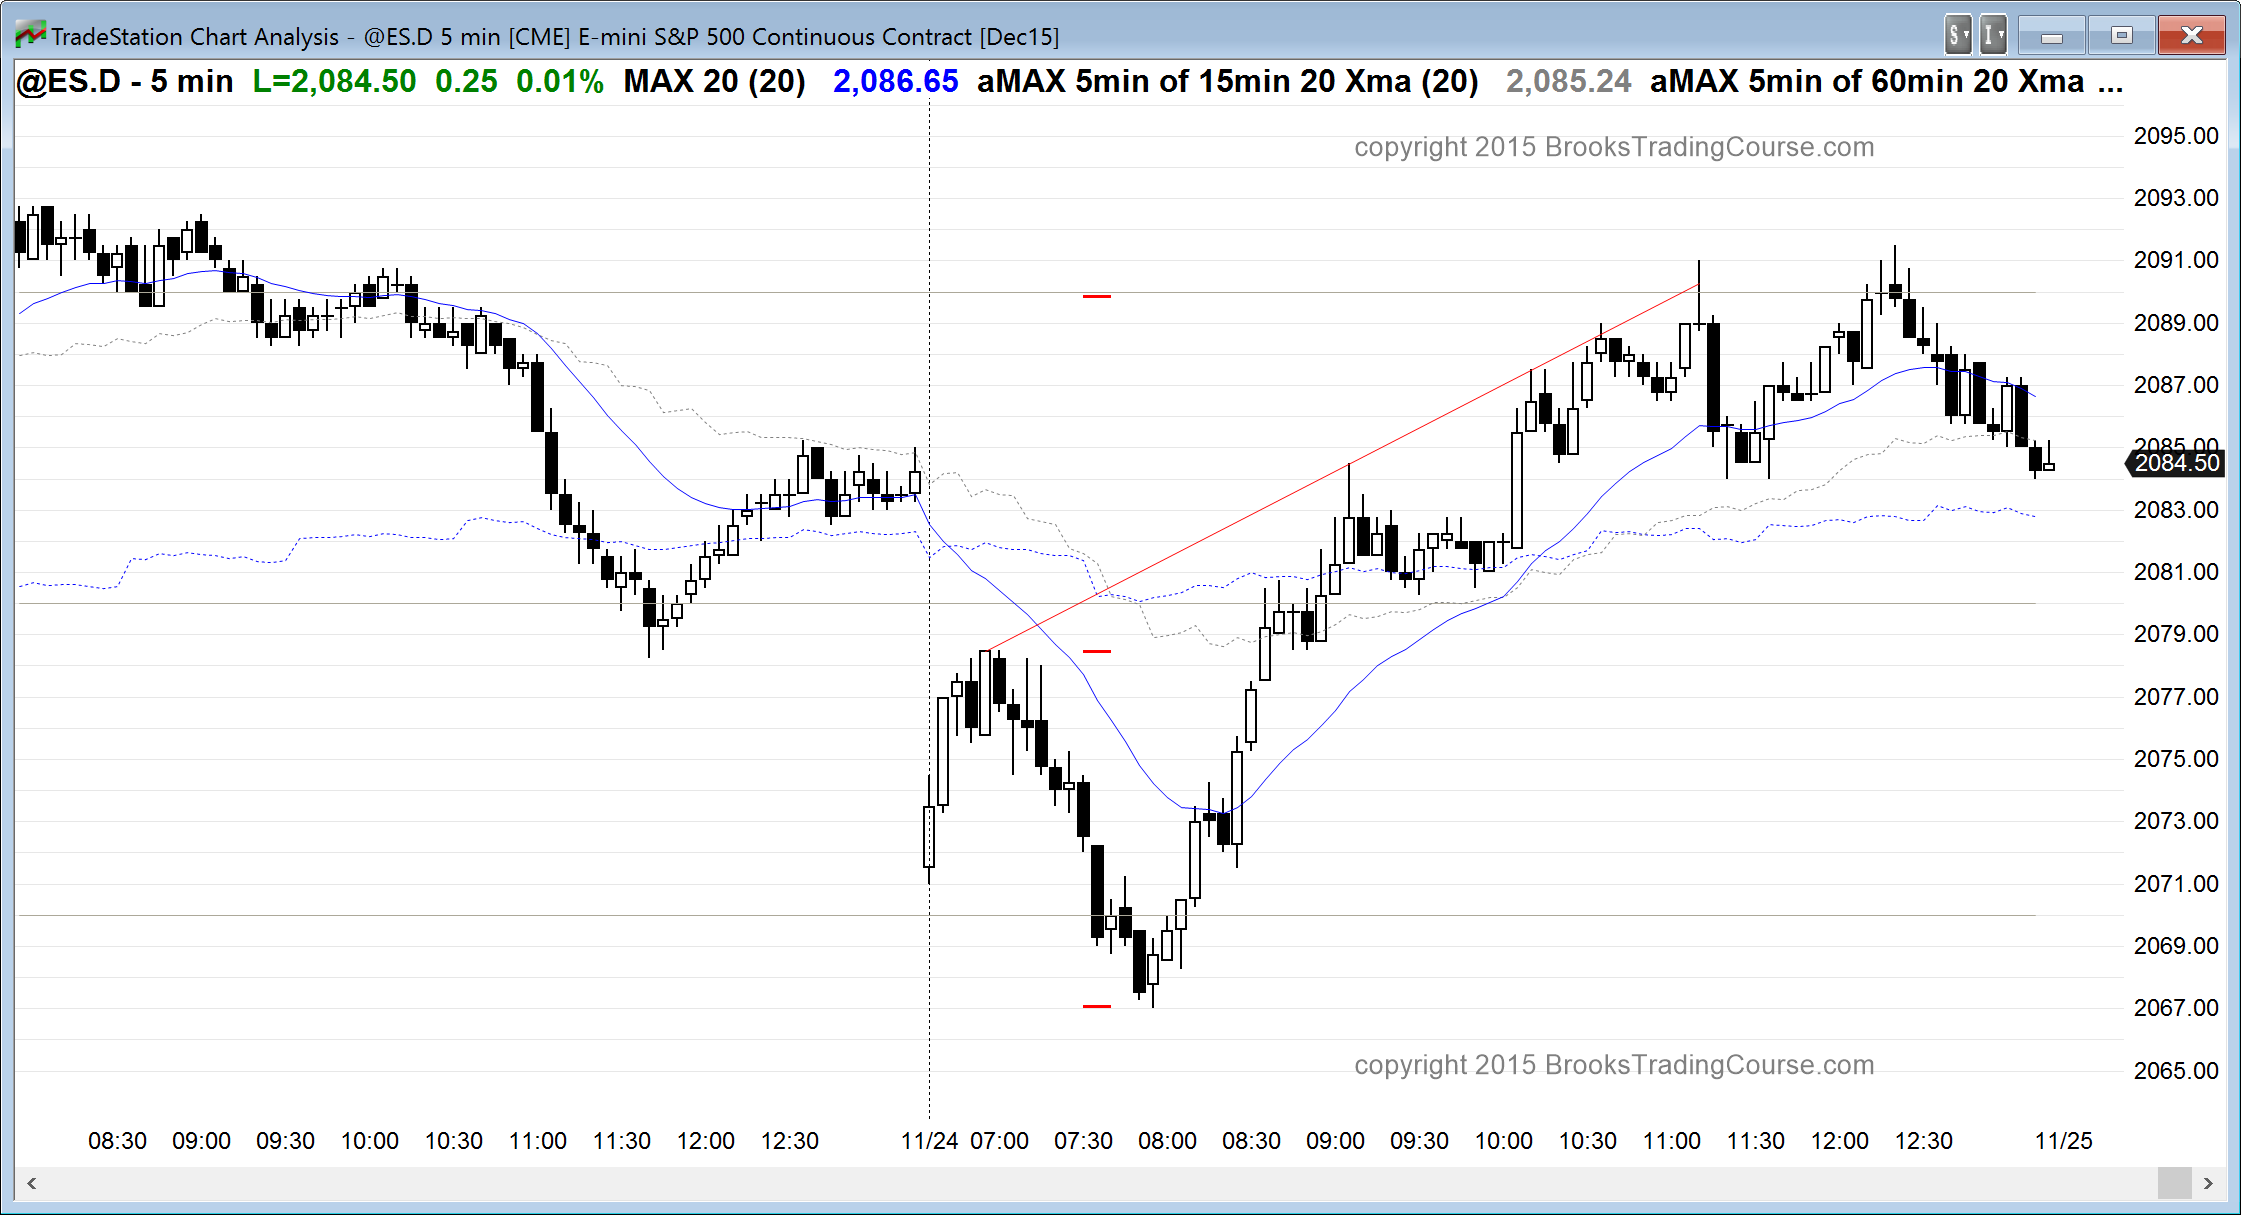
The Emini sold off on the open and formed a double bottom higher low major trend reversal on the Globex chart. The day session became Always In Long after the 3rd or 4th consecutive bull bar in the reversal up from the low. There were several gaps in the rally, proving that it was exceptionally strong. This increases the chances of a test above the November high this week, and possibly the all-time high within 2 weeks. For the bears, they will try to keep the Emini from going above those highs, hoping for a lower high major trend reversal on the weekly chart. The momentum favors the bulls, but the resistance favors the bears. They each have about a 50% chance of success.
Original post was published at Al Brooks Price Action Trading Blog. Check Brooks Trading Course and get the most comprehensive source of information on price action trading available!


