Looking at the quotations of the Canadian dollar (CAD) against the Swiss franc (CHF) you can see an extremely interesting situation. It turns out that this market currently creates two technical price formations at the same time. We are talking here about the formations of an bearish channel and a triangle.
The formation of the bearish canal can be determined on the basis of lower and lower highs from mid-May and early October and November this year, as well as lower and lower lows from the second half of June and the first half of September this year.
Naga Markets is an investment company licensed by CySEC, offering access to SwipeStox, a social app for traders, where they can share their trading ideas about Forex, stock indices and CFD’s thanks to simple professional investors’ transaction mirroring.

The triangle is formed by the same lower and lower highs as in the case of the canal, however, its lower limit is determined by the lows from the beginning of March and September of this year as well as this-weekly minimum.
Analysing the current situation in this way, we can see that as a result of the rejection of the upper limit of both formations, two dynamic downward impulses separated by a small consolidation appeared. These drops reached the lower limit of the triangle (green line), where already last Tuesday there was a rather strong demand response. Since then we have seen increases and if this trend continues, in the near future we could expect a re-test of the recently defeated local support (now resistance) around the 0.7470 level.
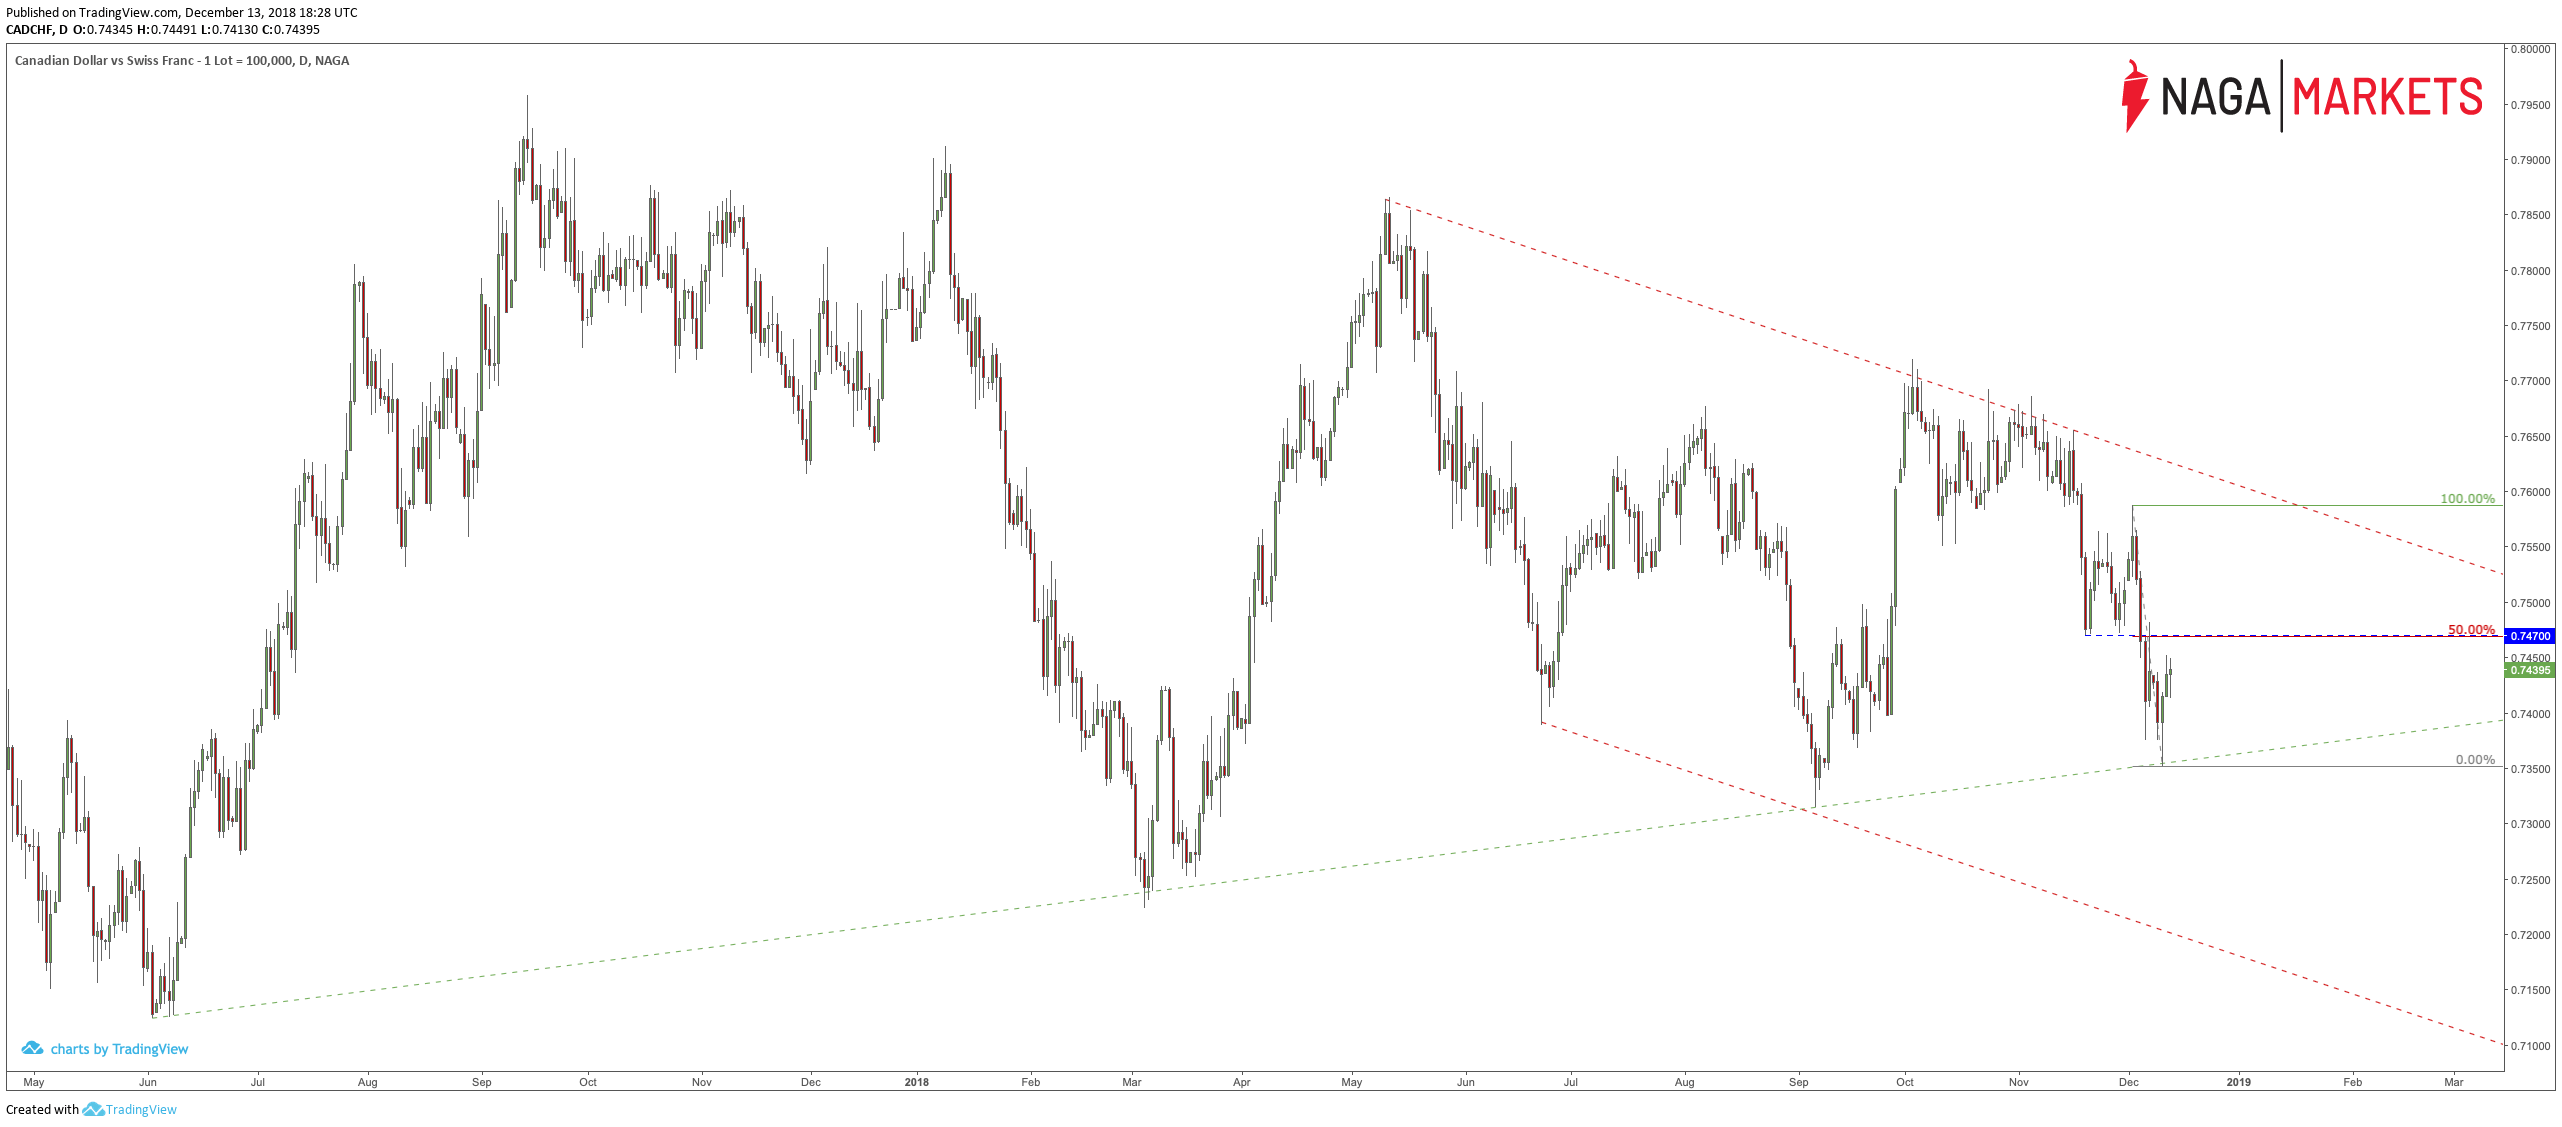
Considering that this resistance coincides with the measurement of the 50% Fibonacci correction from the last downward impulse, it cannot be ruled out that there may be a supply response in his area. Therefore, if there were a classic polar shift principle and the level that had been a support so far, would have been tested and rejected from the other side (as resistance), we could expect to see further declines.
It is then that the lower limits of both formations should be taken into account. If the exchange rate of the CAD/CHF were to fall below the (green) upward trend line, which is the lower limit of the triangle formation, we could expect further falls, for which even the area around the lower limit of the downward channel seems to be the real range.


