AUDJPY – Inside Bar On Resistance
On daily chart of AUDJPY was formed an inside bar formation where yesterday's candle is closed in range of preceding candle. The formation appeared on major...
March FOMC Fed interest rate hike stopping Trump rally
Monthly S&P500 Emini futures candlestick chart:
Buy climax at the Final Bull Flag measured move targets and the 2400 Big Round Number
The monthly S&P500 Emini...
Trading Price Action Patterns -GBPUSD 27/02/17
I see great potential for GBPUSD to return to further growth. Price after breaking from the bearish channel drawn a new channel, this time...
How to Easily ID Support and Resistance on Your Charts
See an example in the chart of Bank of America (BAC)
By Elliott Wave International
You've probably heard the terms "support" and "resistance." Common technical...
How Can The Elliott Wave Principle Improve My Trading?
Answer: Every trader, every analyst and every technician has favorite techniques to use when trading. But where traditional technical studies fall short, the Wave...
Trading Inside Bars -NZDUSD 13/02/17
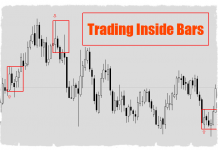
Trading Inside Bars –under this heading you will find analysis made on basis of one of the most known Price Action formation – Inside...
Trading Inside Bars -AUDUSD 10/02/17
Trading Inside Bars –under this heading you will find analysis made on basis of one of the most known Price Action formation – Inside...
GBPAUD – Bearish Pin Bar On Resistance
On H4 chart the currency pair GBPAUD formed a bearish pin bar, which may be a signal for price action traders. It is worth...
Trading Inside Bars -NZDUSD
Trading Inside Bars –under this heading you will find analysis made on basis of one of the most known Price Action formation – Inside...
Al Brooks Price Action: Emini Island Top And Island Bottom Bull Flag
Monthly S&P500 Emini futures candlestick chart:
Bull breakout is losing momentum
The monthly S&P500 Emini futures candlestick chart is in a bull trend. When a gap...


