 Very interesting “figures” draws pair CHFJPY on the Weekly and Daily charts. I do not like pairs with Swiss franc (CHF) due to its volatility resulting from unpredictable SNB actions (I still remember January 2015 ) and higher spread than on other crosses, but looking generally at the currency market – should the word “predictability” be used in Forex world?
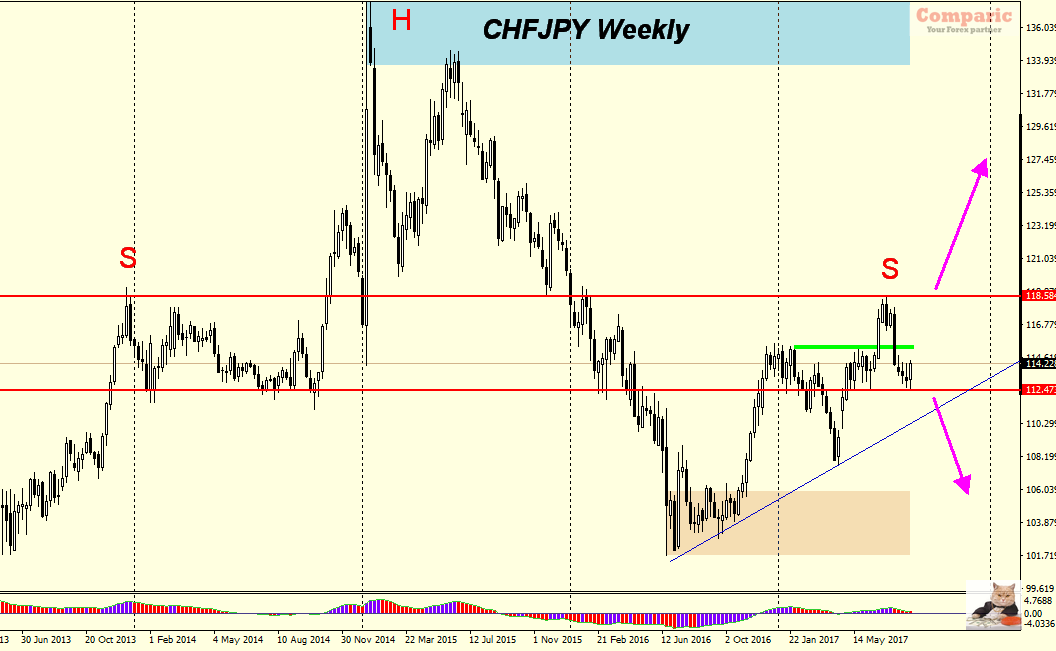
Returning to the charts – On Weekly we have a clearly outlined formation Head & Shoulders with shaped arms at 118.58 and neck line at 112.47.
Interestingly, when going to the Daily chart – we also see H&S formation, but still under construction … where the whole formation is in the same time the right arm of the H&S from the Weekly chart. The right arm of the formation on Daily chart has not yet been formed, it is missing about 100 pips for the pair to reach the (green) zone, which is the level of the left arm. Both H&S – the ones from Weekly and the Daily ones have the same neckline level at 112.47 – suggesting that breaking this level could lead to dynamic declines up to 600 pips which is the height of the H&S formation from the Daily chart.
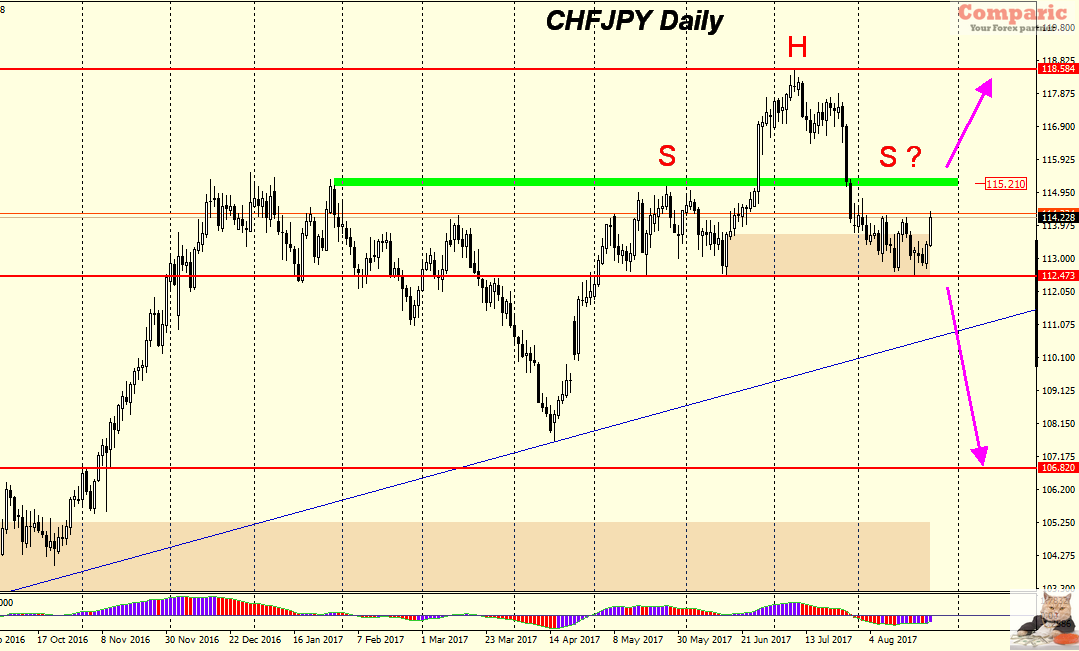
But before that we have to finish drawing the right arm and CHFJPY should reach the green zone – 115.20. A clear and permanent breaking of 115.20 may negate the entire H&S formation and the pair will head north. Given that we are analysing weekly and daily charts – this might be an interesting setup for the next week, maybe two or even longer.


