 Daily volume trading is a cycle of price behavior analysis, combined with the actual volume that is drawn from regulated market.
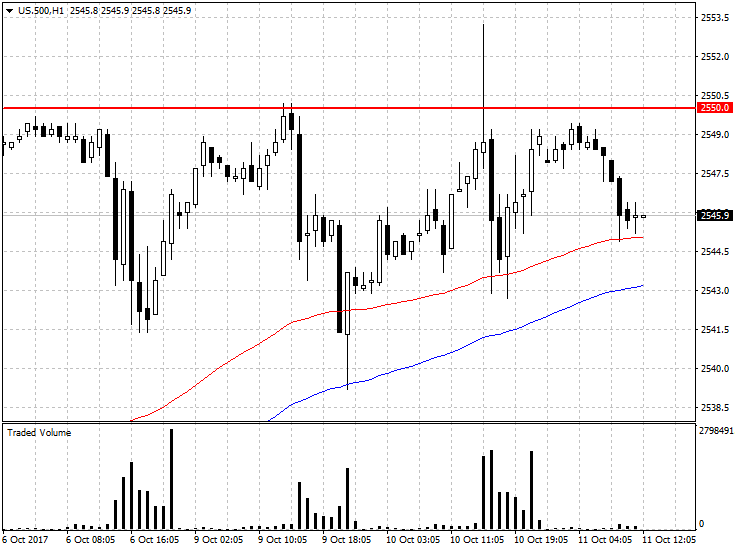
SP500
On chart US $ 500 we see a new historic high. It is worth noting the formation of the falling star, which occurred during the large volume. This candle pattern can lead to a stronger correction. Further demand pressure along with a break out thru the top is likely to lead to a greater impulse and a test of round 2600 pts.
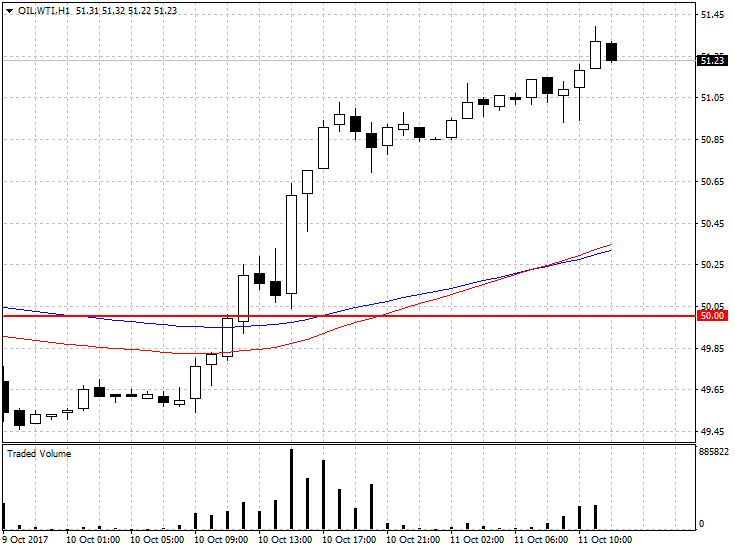
 OIL WTI
WTI OIL prices broke the psychological support level of $ 50.00 and are approaching a round resistance level of $ 51.50. Growth is followed by increasing turnover. This situation points to advantage of the demand side. Breaking up the previously mentioned area with confirmation on the volume may lead to higher increases. A positive VSA reaction will increase the chances of a correction.
 EURUSD
On the EURUSD chart price is testing a strong psychological level of 1.1800. According to yesterday’s analysis, there is an increasing turnover in this area. It is worth noting the decreasing volume accompanying the new highs. This situation may prove of weakening of buying power. A return below the previously mentioned level may lead to larger falls.


