Monthly S&P500 Emini futures candlestick chart: Candlestick pattern is a bull flag
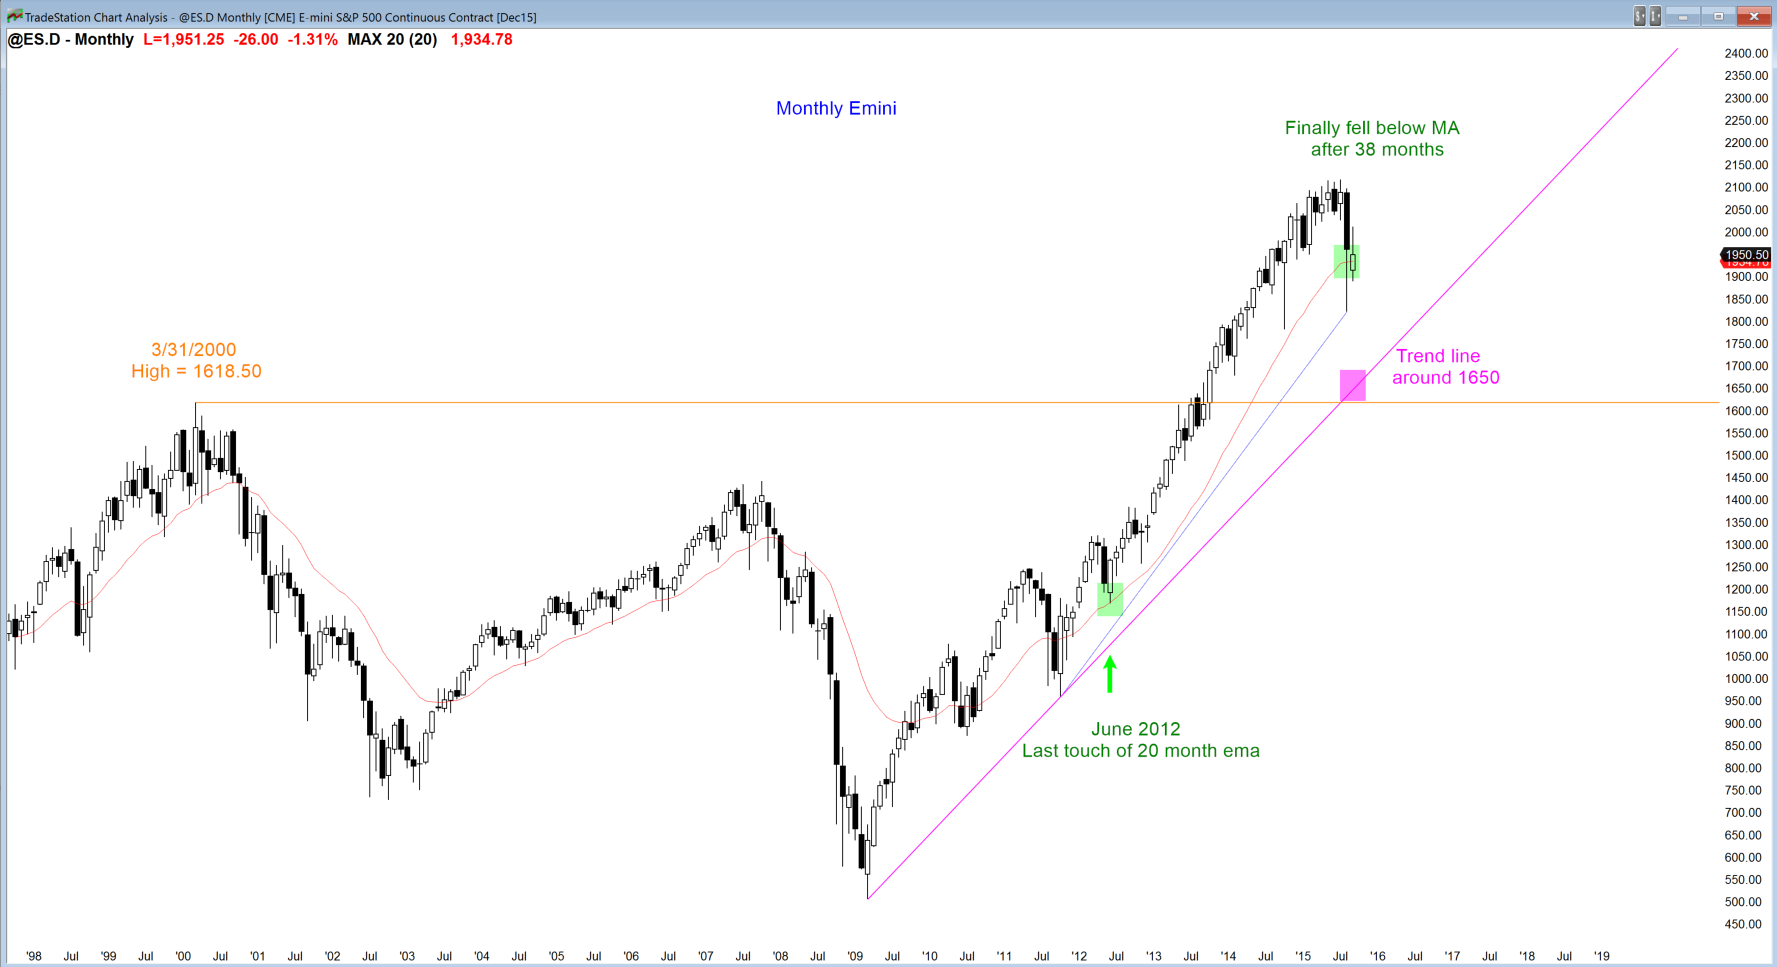
The monthly S&P500 Emini futures candlestick chart finally pulled back to the moving average after 38 months above it. The buyers at the moving average have been able to prevent further selling so far after last month’s huge selloff, but they might soon fail.
When a market is strong enough to stay above its moving average for 20 consecutive bars, the bulls are buying above an average price and are strong. Once they have stayed above for 30 – 40 bars, the rally becomes climactic. There have only been two other times in the past 50 years when the S&P500 cash index held above the moving average for 38 months or more. In 1998, it corrected 22%, and in 1987, it fell 36%. The Emini is still Always In Long, but the odds of a climactic reversal are about about 50%. A 36% correction is unlikely, but a test below the October low of last year would be a 16% correction, and that has about a 50% chance of happening.
A climactic reversal usually creates a selloff that is sideways to down, and lasting about 10 or more bars. This means that this pullback on the monthly chart might last a year or more. One downside target is last October’s low. Next is the bull trend line from the 2009 low, and then the March 2000 high of 1618.50. At the moment, these 2 lower targets are unlikely to be reached in the current leg down, but they are close enough to have about a 30% chance of being hit before the bull resumes up to a new all-time high.
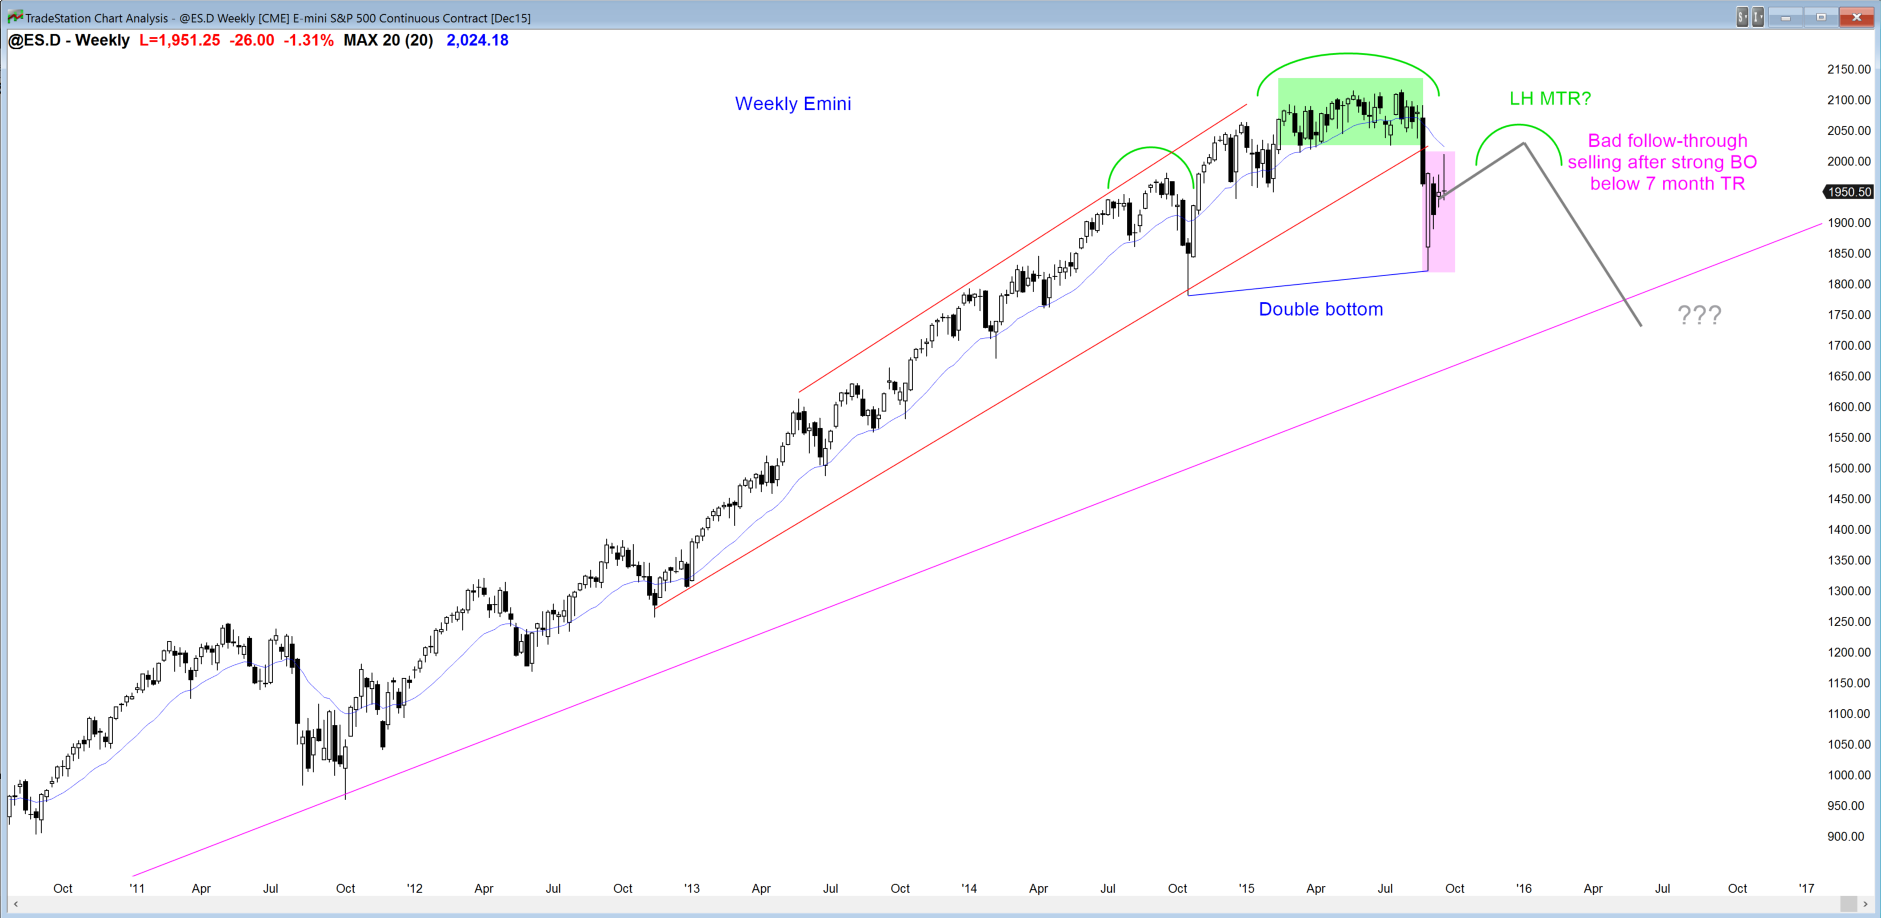
Weekly S&P500 Emini futures candlestick chart: Traders learning how to trade the markets should be ready for a head and shoulders top
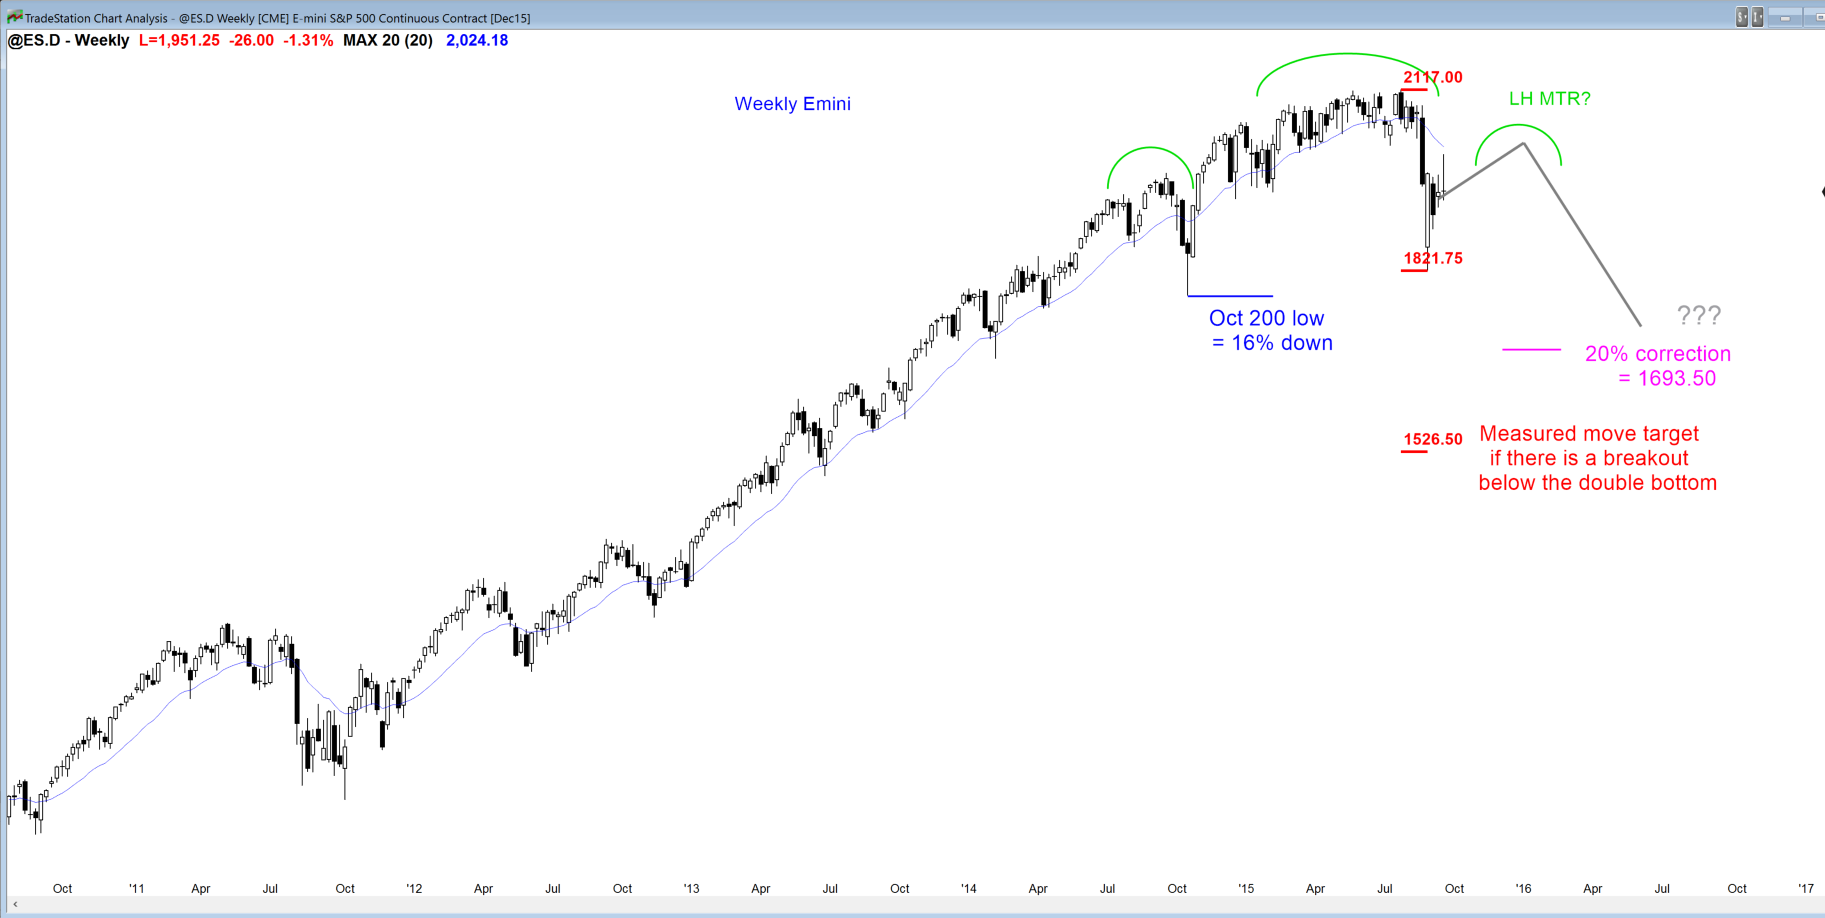
Support levels for the S&P500 Emini futures candlestick chart. The October 2014 low would be a 16% correction. A 20% correction would be 1693.50. A measured move down if the Emini breaks below the double bottom would be 1526.50.
The reversal up was strong enough so that the bounce might last for several months. However, if it does last that long, the pullback from the bear breakout will probably create a lower high major trend reversal candlestick pattern. If one forms and there is a bear breakout below a good bear signal bar, there would be a 40% chance of a 2nd swing down, which could fall far below the October low.
It could easily fall for a measured move down based on the height of the pattern. Traders will look for a move down equal the height of the neckline of the double bottom (which is the all-time high) down to the double bottom. The range is about 300 points, and that means a 600 point correction from the high; that target is 1526.50. This would test the 2000 high and the monthly bull trend line. Although this is unlikely at the moment, traders should be open to all possibilities, and not be too quick to buy if the market begins to sell off again. Wait for a test of support.
Daily S&P500 Emini futures candlestick chart: The bear flag continues to add more bars
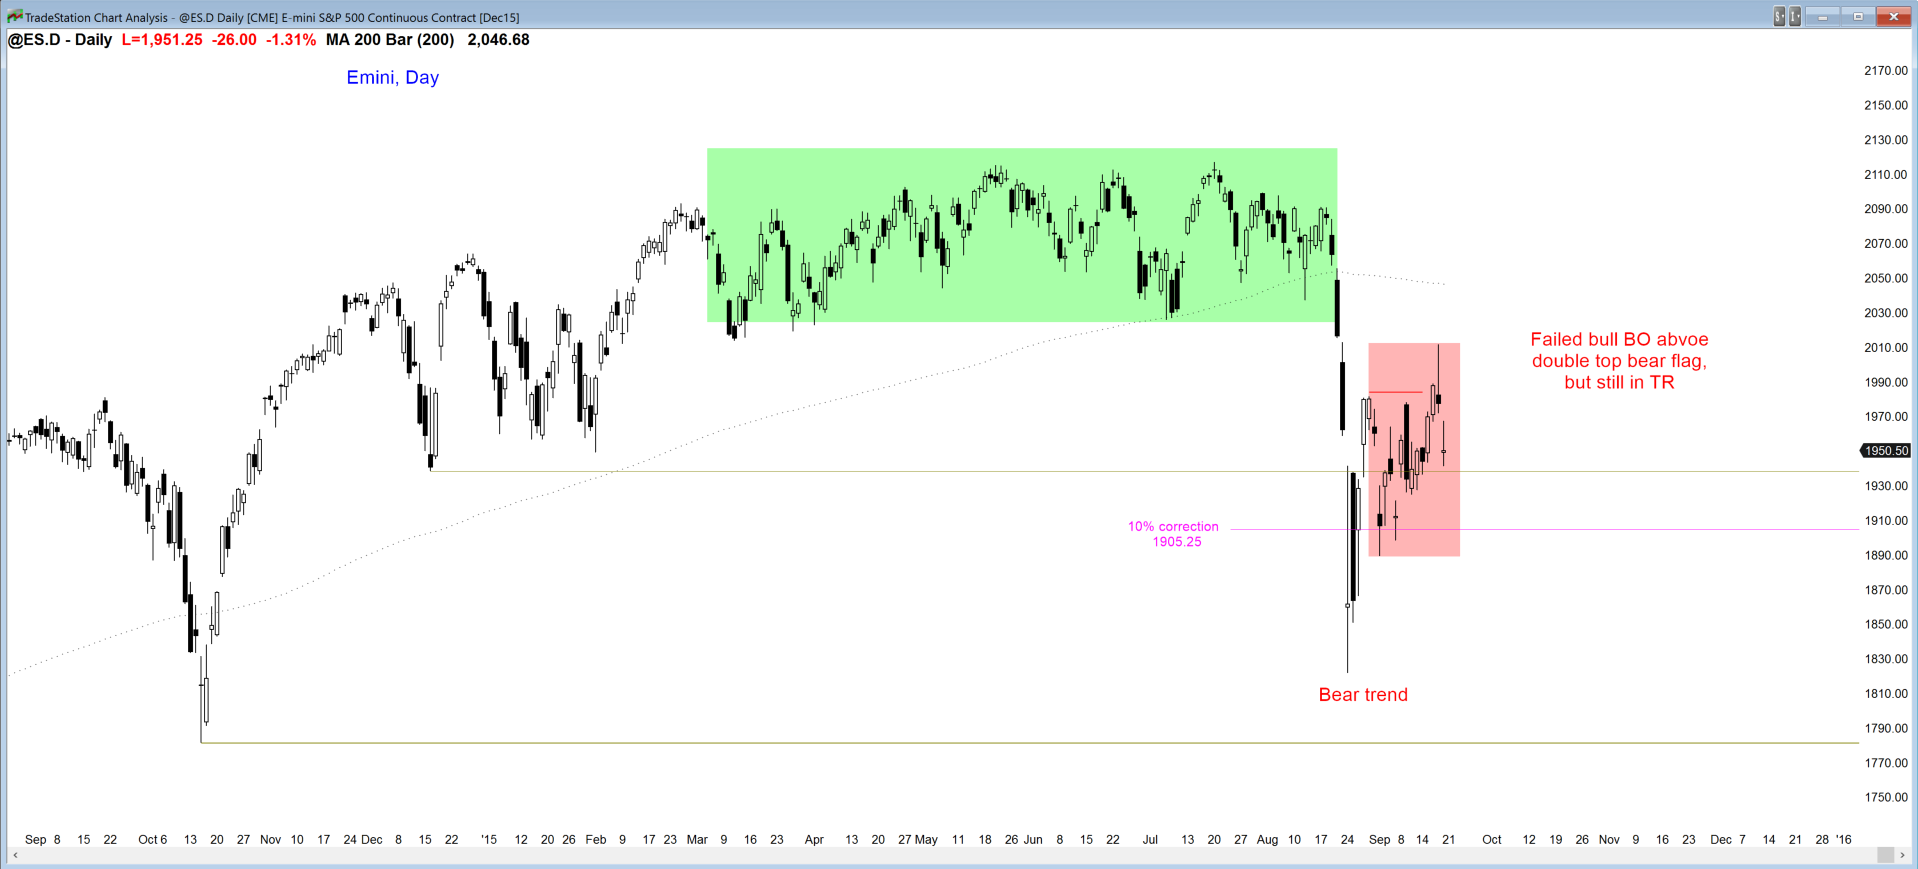
The daily S&P500 Emini futures candlestick chart has been sideways since last month’s collapse. That selloff was so unusually strong that it has a high probability (60%) of a 2nd leg down that falls for some kind of measured move. The two most common possibilities are a leg 1 = leg 2 measured move down from a lower high and a measured move based on the height of the bear breakout or the month long bear flag.
There is still a 40% chance that the correction is over and that the current rally will reach a new high. If there is a new high, there is at least a 50% chance that it will fail and form a large expanding triangle top (a type of higher high major trend reversal) and then another big reversal down. It will take at least a couple of years for last month’s selloff to fade in importance, and until then, it will continue to have a major influence on the price action.
Original post was published at Al Brooks Price Action Trading Blog. Check Brooks Trading Course and get The most comprehensive source of information on price action trading available!


