EURAUD – I have written about this pair twice recently. On Wednesday last week I analysed a bearish formation (Outside Bar) which was formed on this pair. This week, the price left the formation thru the bottom falling to the nearest support level of 1.5980. There was a demand reaction that led to the lower limit of the OB in accordance with the former analysis. Today, there were again drops and another retest of said OB.
Why is this pair analysed by me for the third time this week? The situation presented on the H4 chart should be the answer.
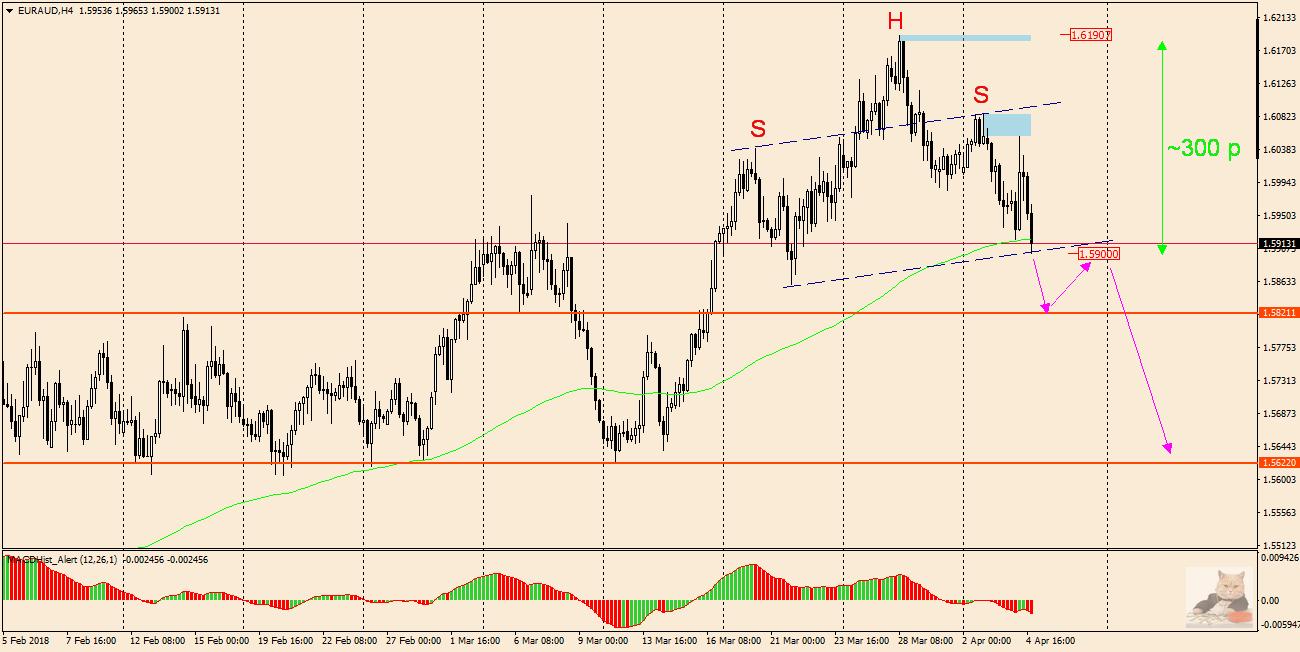
Currently, the pair has drawn a characteristic Price Action – Head and Shoulders formation. The price is actually at the “neck” level. If this level is effectively broken (1.5900), considering that H&S is a bearish formation – we can expect further declines. The range of these drops can be up to 300 pips, the same as the range (height) of the formation.
Of course, along the way, the price will come across some support on which local corrections may occur. The first one can be the level of 1.5820, where the price may be turned back to test the previously broken neck line, if the bearish scenario is implemented. In the event that the market goes north not effectively crossing the neck line, overcoming the level of the right shoulder 1.6090 will negate the downward trend.


 Review")


