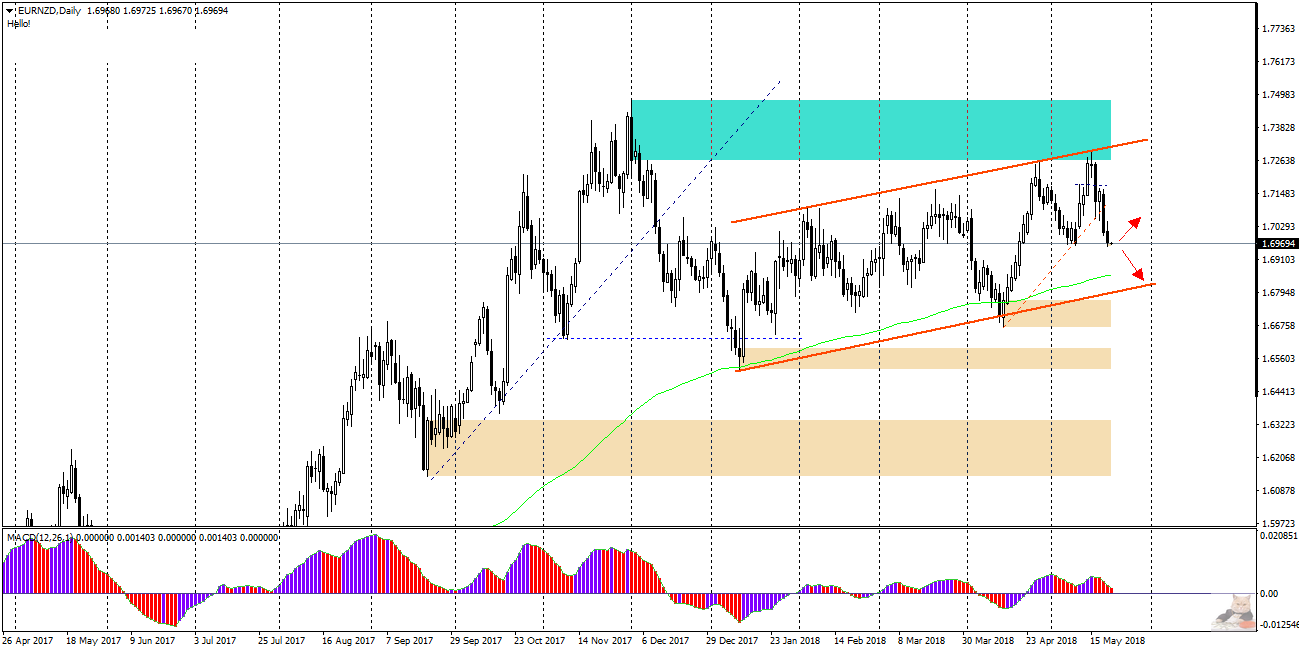
In the previous analysis of this pair from May 15, I wrote that on the Daily chart, we notice that the pair is moving in a growth channel with a small inclination and range of 550 pips.
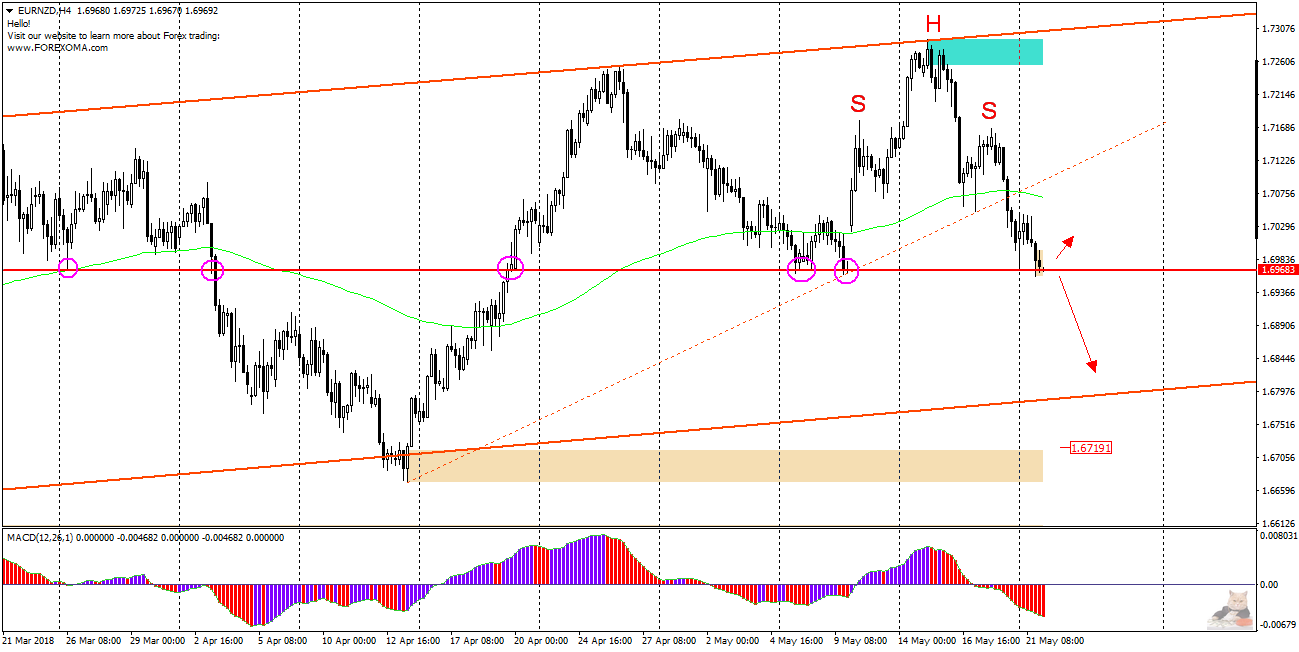
On the H4 chart was created a divergence between the MACD oscillator and the price which according to the assumptions of the PA + MACD strategy predicted declines. The assumed scenario was implemented and the price reached the upward trend line run at lows from 13.04 and 09.05.
Currently, this trend line has already been defeated and the declines are continuing.
On the H4 chart (below) we can see that the price is at an important level of 1.6970, which served as support several times before.
In addition, we can distinguish the formation of Head & Shoulders, and actual level is currently the neck line of this formation. It is worth observing the price behaviour at this level in the near future, because its effective overcoming may lead to further declines, and then the nearest supply target will be 1,6900 and further support of the growth channel, which I mentioned at the beginning (oblique red line)
If H&S does not materialize and the price does not break the neck line, we can expect a return to growth and the previously broken upward trend line (dotted red).


