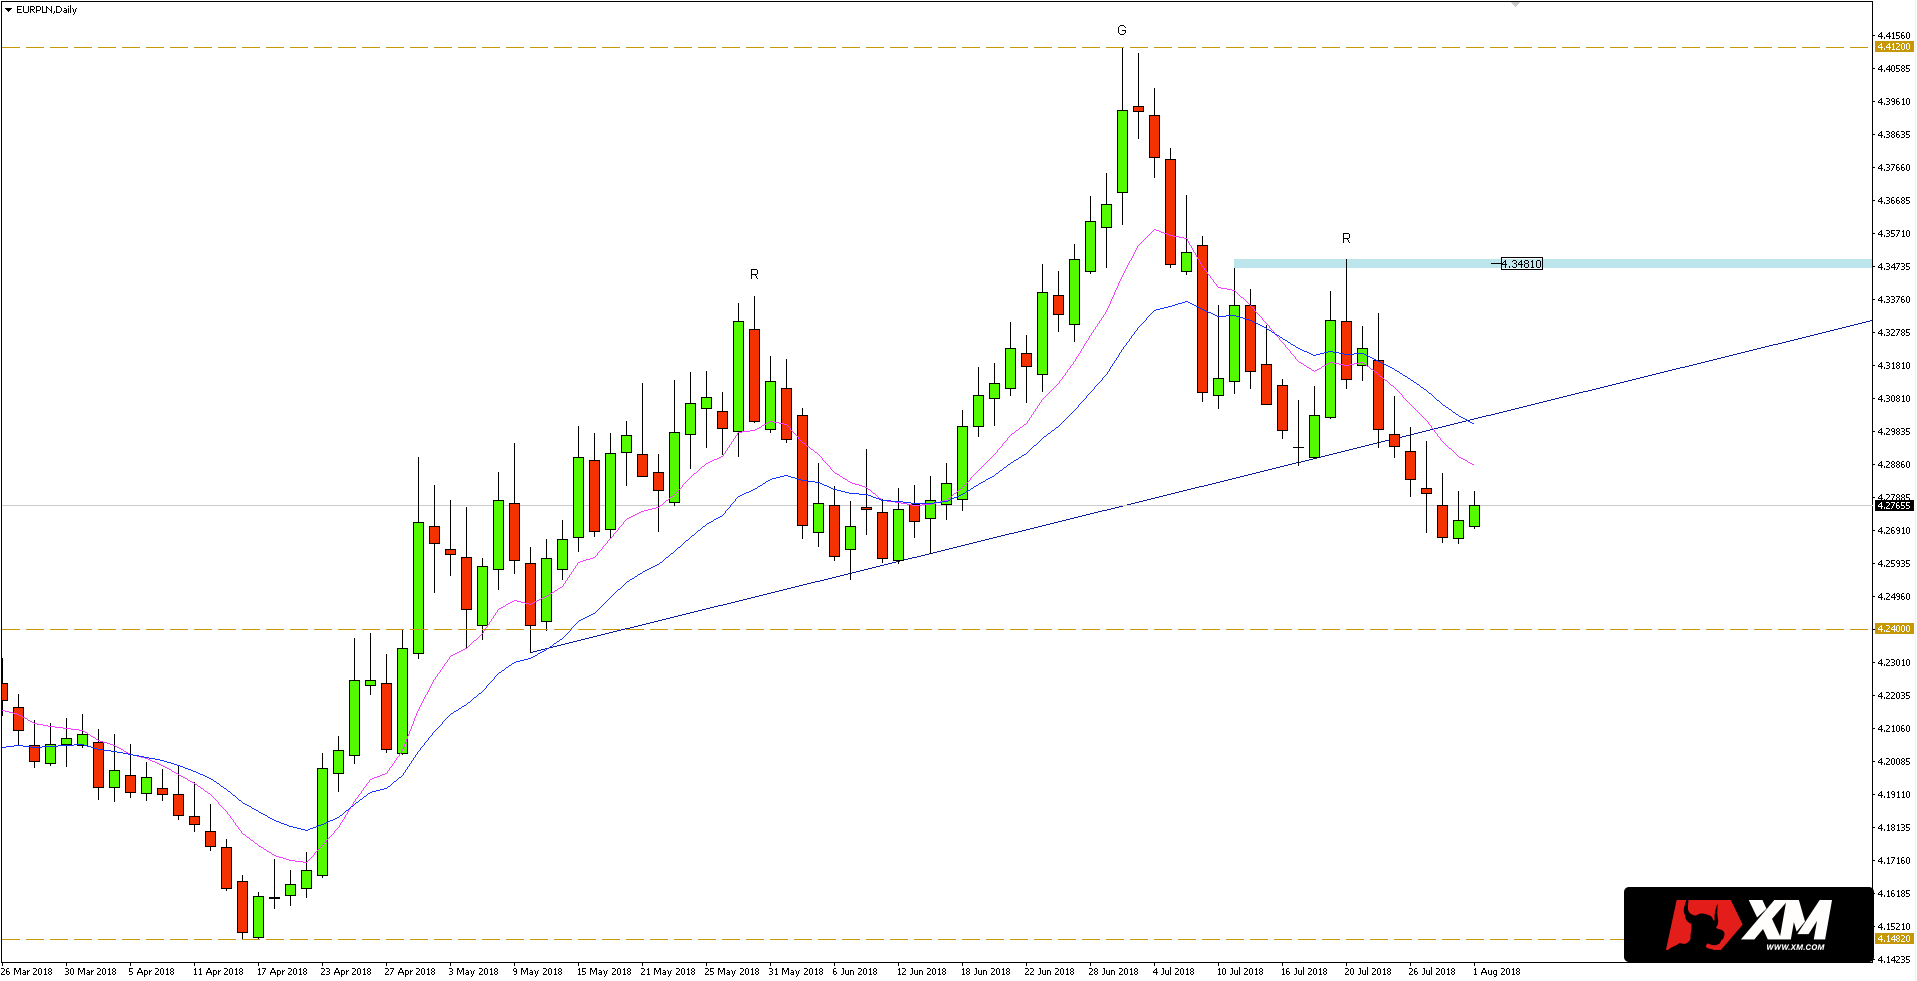
The last analysis of the EURPLN currency pair referred to the rebound of the quotations from the upward trend line running from the low from May this year. After rebound, the pair turned to the local resistance at 4.3481, which was defended at the closure of the day.
The following days brought weakening, as a result of which the rate was again on the trend line. This time, however, the supply side won, which led to breaking the trend line.
The aforementioned trend line is also the neck line of the head and shoulders formation, the range of which is up to 1350-pips. However, before sellers could achieve the reach of the formation, they would first have to overcome horizontal support at 4,240.
I trade on this instrument at broker XM, which has in its offer more than 300 other assets >>
Anyway, the sell signals can now be found in the vicinity of the broken trend line, which changed to resistance from being support. It is also worth observing how the course behaves on the dynamic resistance provided by the 10 and 20-day EMA.