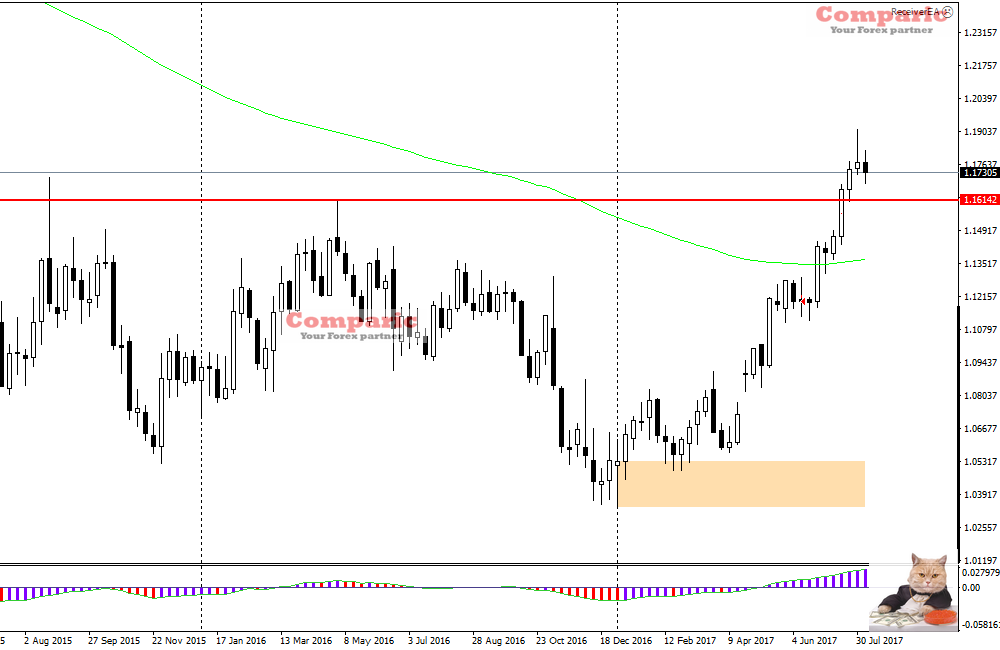
Since beginning of the year EURUSD is in an upward trend. The lowest rate this year pair reached January 3 was 1.0340. Since then, we have seen increases that reached last week handle 1.1910 which gave 1570 pips. The last weekly candle has shape of a pinbar with a fairly large upper shade which may announce a downward correction.

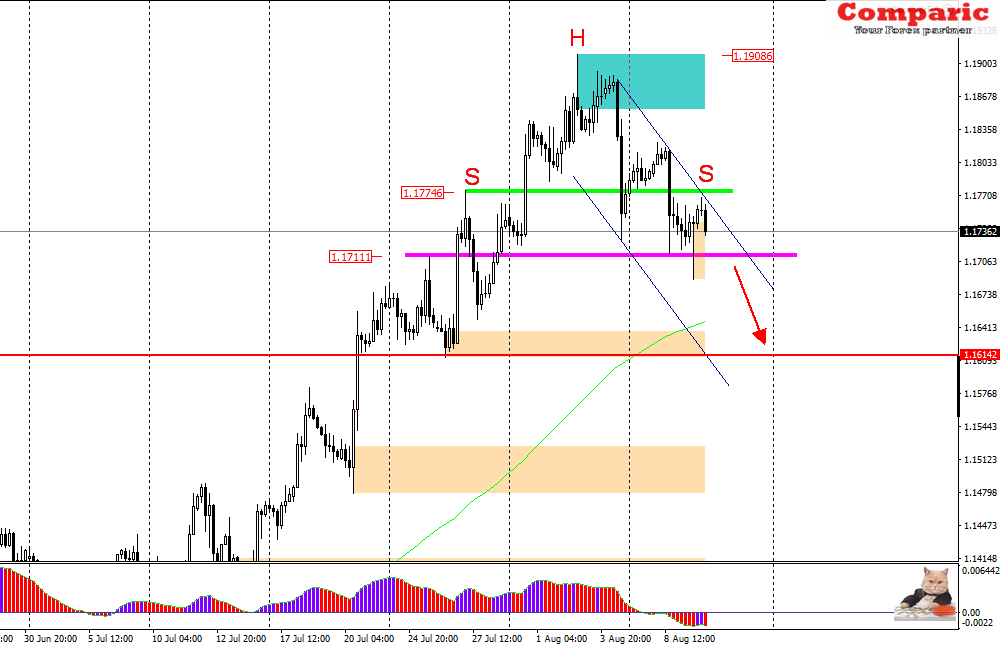
Looking on chart H4 we can observe the first signs of weakening of demand on this pair, the bearish candles are clearly larger than the bullish ones. Perhaps a Head and Shoulders formation is formed where the right shoulder was established today at night on level 1.1775 (green line) and the hypothetical neck line ( pink ) at 1.1710. It is difficult at this time to predict whether the formation of H&S will be completed so it is worth looking at the behavior of price at the mentioned (pink) level and wait for closure of daily and weekly candles before taking a trading position. If the formation of the H&S becomes a fact – looking from the technical side, falls can have range of 200 pips equal to height of this formation. (Maybe we will have similar situation to recently described here : https://comparic.com/plan-week-7-11082017-nzdusd-head-shoulders/ ? )

However, on the way of declines pair have an obstacle – a strong support level of 1.1614 based on the peak of 3 May this year where on 26 July EURUSD strongly rebounded and reached this years high 1,1910.


