The last June’s daily candle on GBPJPY cross had a range of 190p, preceded by a Thursday pinbar, was significantly bullish. Looking for an answer as to whether further increases are possible, one has to look at pairs correlated with GBPJPY – that is GBPUSD and USDJPY.
Looking at the GBPUSD chart we can see that the last day of June was also very bullish, additionally, we have divergence on D1 and increasing value of the MACD oscillator (PA+MACD strategy) which can support further appetite for growth.

The USDJPY chart (below) shows that the price has reached the local downward trend line and the next long-term trend line is about 100p higher. Overcoming the local line can give an impulse for further increases, so it is worth observing the price behaviour and if the pair will break the local trend line successfully think about going long.

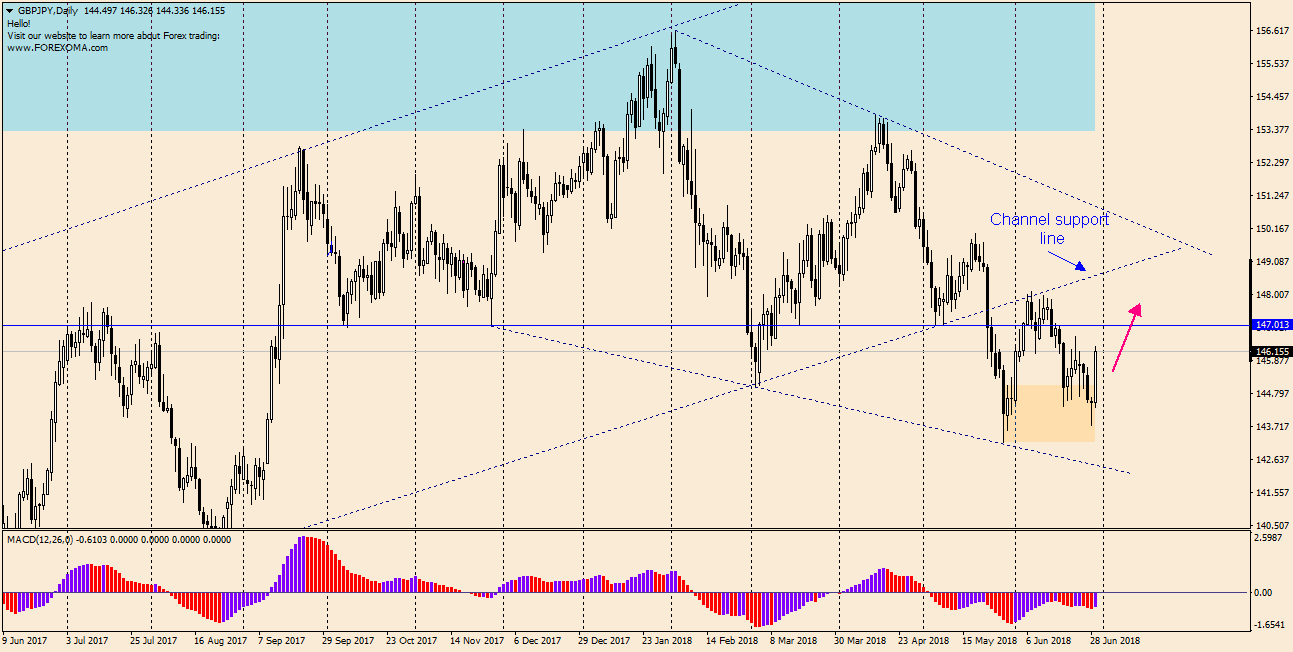
Strengthening of the pound and weakening yen would result in increases on the GBPJPY cross. If the above scenarios prove to be successful, the GBPJPY pair (below) has a chance to go northwards and reach the support of the growth channel, which it left on 23 May this year in a dynamic way drawing a 300 pip bearish candle. I will “hunt” for a pullback to enter long trade.


 Review")


