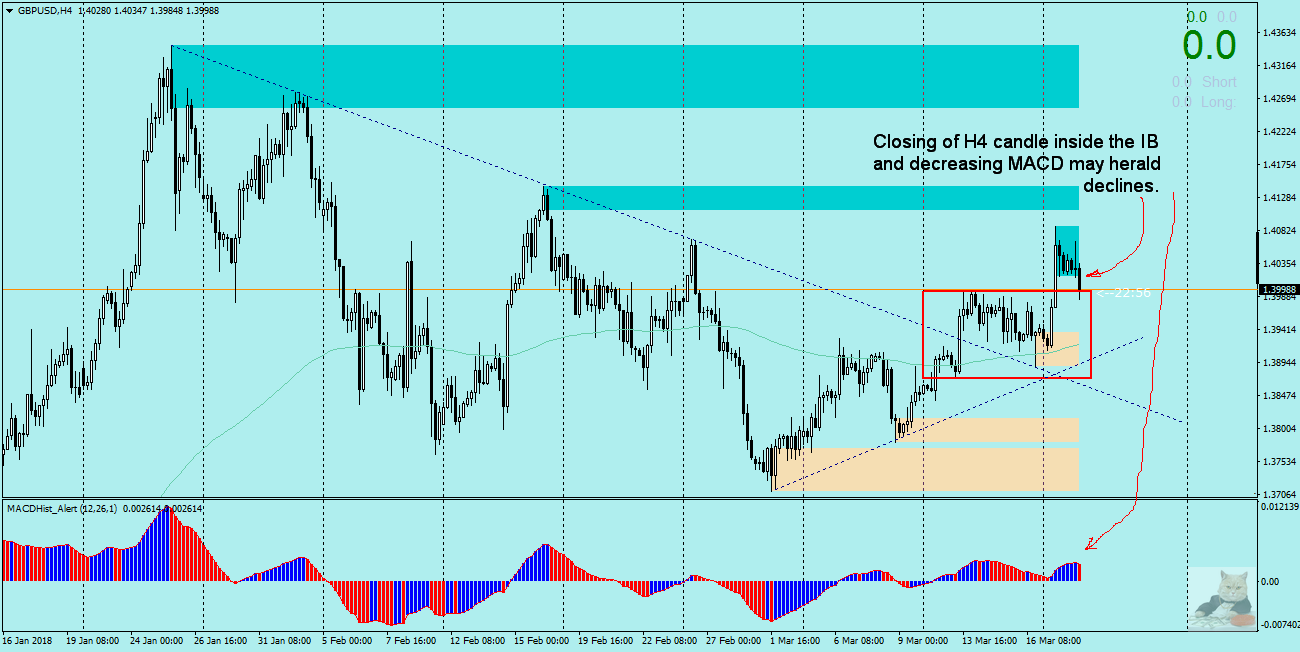
Recently, I described how the MACD oscillator readings can help us evaluate the situation on the graph of the pair we are interested in. According to the PA strategy supported by the MACD – when the value of the oscillator begins to decrease and at the same time the corresponding candle (in this case H4) is bearish, it may forecast falls, at least to the nearest support level. At GBPUSD the moment is approaching when Price Action and MACD can show us which direction the pair will follow in the near future. An additional element of the situation on the chart is Inside Bar, from which dynamic breakout occurred yesterday. If the price overcomes its upper limit and returns to the inside IB, it may be a signal to retreat, supported by the MACD (decreasing value) indication and a large bearish candle on H4. Wery probable is forming of a bearish divergence between price and MACD what supports me in my bearish bias. Of course, there may also be a rejection of the IB upper limit and a return to growth – I think, it will clear up during today’s session, the closing of the daily candle can decide the fate of the pair in upcoming sessions.
Tomorrow, FOMC – this should be taken into account – probability of raising interest rates in the US it is very large which can weaken other currencies against the dollar (and supports my bearish attitude)


