There have been a decent triangle pattern formations in the GBPUSD pair. Most long-term traders are cautiously waiting for a clear breakout to execute their trade. However, aggressive traders have made a decent profit by shorting the pair right at the bearish trend line resistance, at 1.31481. Currently, the pair is testing the major trend line support at 1.27900. This level is also reinforced by the 61.8% bullish Fibonacci retracement level, drawn from the low of 2nd October 2016 to the high of 15th April 2018. Though a bullish price action confirmation signal will definitely attract the long-term buyers the current triangle pattern formations and long-term bearish trend strong argues against taking a long-term position. Let’s dig into the details.
GBPUSD technical chart analysis
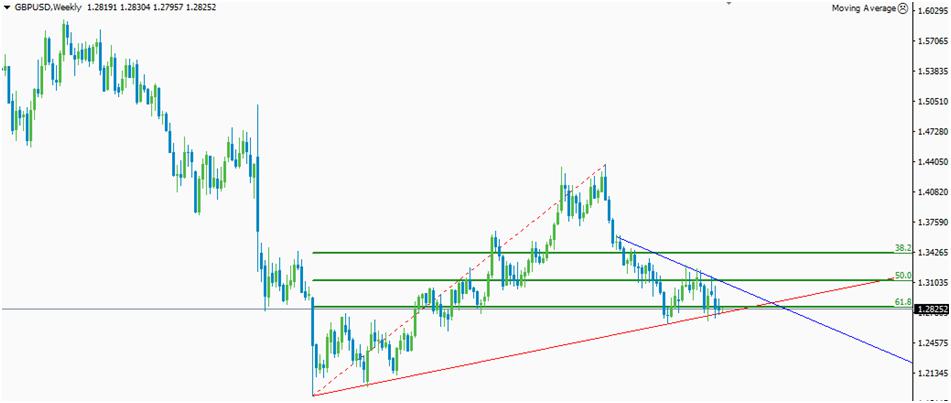
Figure: GBPUSD testing triangle floor and bullish trend line support
From the above figure, you can clearly see the pair is now testing a major support level at 1.27900. If this support level holds, the pair will eventually lead towards the bearish trend line resistance at 1.30818. From that level, the sellers might try to take control of this market, but a clear break of the price above that level will eventually lead this pair towards the next major resistance level at 1.34262. This level is going to play a crucial role since a clear break of this level will confirm the bullish breakout of the current triangle pattern and a temporary bottom formation at 1.27900. Once we have a temporary bottom in place, the bulls are most likely to push this pair towards the high of 15th April 2018. Breaking that critical resistance level will be extremely hard since we have plenty of resistance candles. However, a weekly closing of the price above the major resistance level at 1.43511 will confirm the end of a strong bearish movement of the GBPUSD pair.
On the downside, we need to break below the triangle support level at 1.27900 to establish fresh selling momentum. The conservative traders in the Forex market are expecting a bearish breakout since it favours the long-term bearish trend. A daily closing of the price below the trend line support level will lead this pair towards the next minor support level at 1.25505. This level might refuel the GBPUSD bulls, but the surge is most likely to be short-lived. A clear break of the minor support level at 1.25505 will eventually lead this pair towards the low of 25th September 2016. This level is going to play a crucial role in the next potential movement of this pair. Any bullish price action confirmation signal right at that level will be an excellent opportunity to execute fresh long orders in favour of bullish correction. However, a decisive movement below the low of the 25th September 2016 will result in a sharp decline.
Fundamental factors
The recent performance of the U.S economy is not up to the market. However, the dollar bulls are steadily holding their gains against most of their major rivals. An imminent rate hike from the FED officials followed by a hawkish statement will create extensive selling pressure to the GBPUSD pair. Most of the leading officials are currently waiting for the upcoming FOMC meeting minutes to decipher the FED rate hike policy prior to the closing of the year 2018. On the other hand, Great Britain’s economy is showing a great sign of recovery for the last couple of months. Moreover, the MPC officials are optimistic about the forecast of their economy. If things go as planned, we might see a surge in the GBPUSD pair before the end of 2018. However, any weak performance in Britain’s labour force will weaken the GBPUSD bulls significantly in the global market. Considering the fundamental and technical parameters involved, it’s better to wait on the sidelines until the pair breaks the current triangle pattern.
by
Dwayne Buzzell


