USDCAD D1
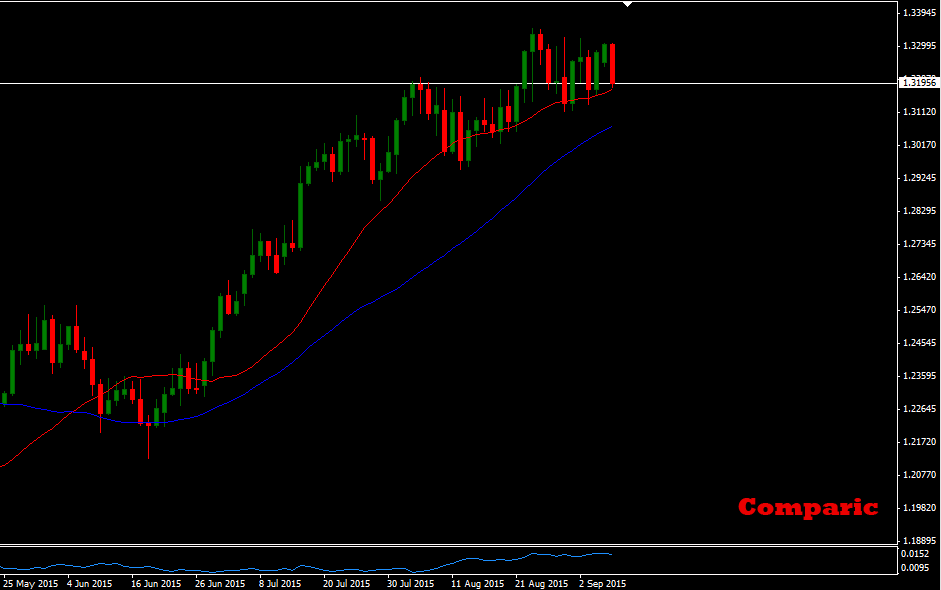
On the chart we can see uptrend. We can identify many tops and bottom, we can differ corrections from impulses and we can see that averages have right shape. On the daily chart there is Enfulging Bar creating. When we analyse price history, we can notice that last Enfulging Bars were very good used by bulls, which didn’t let the price to set new minimum. Let’s take a look at trading chart.
USDCAD H1

On the H4 chart we can see that price is testing support area. This area gave profit to traders two times already, of course if they played aggressive scenario and one time conservative one was good. After last test price didn’t set new peak and now it is testing support again. It is for us final signal and we should not play long another time. Good place to take position is half of the support area, which is lower or breaching resistance area and test from above. Conservative scenario expects taking position after candle signal. You have to remember about MM, don’t use more than 2% of deposit.


