Harmonic trading is mainly a proper measure of price movements using Fibonnacci numbers. Harmonic patterns are formations of movement continuation. Thus, it is important that expected movement will be according to previous trend. Check most efficient harmonic patterns.
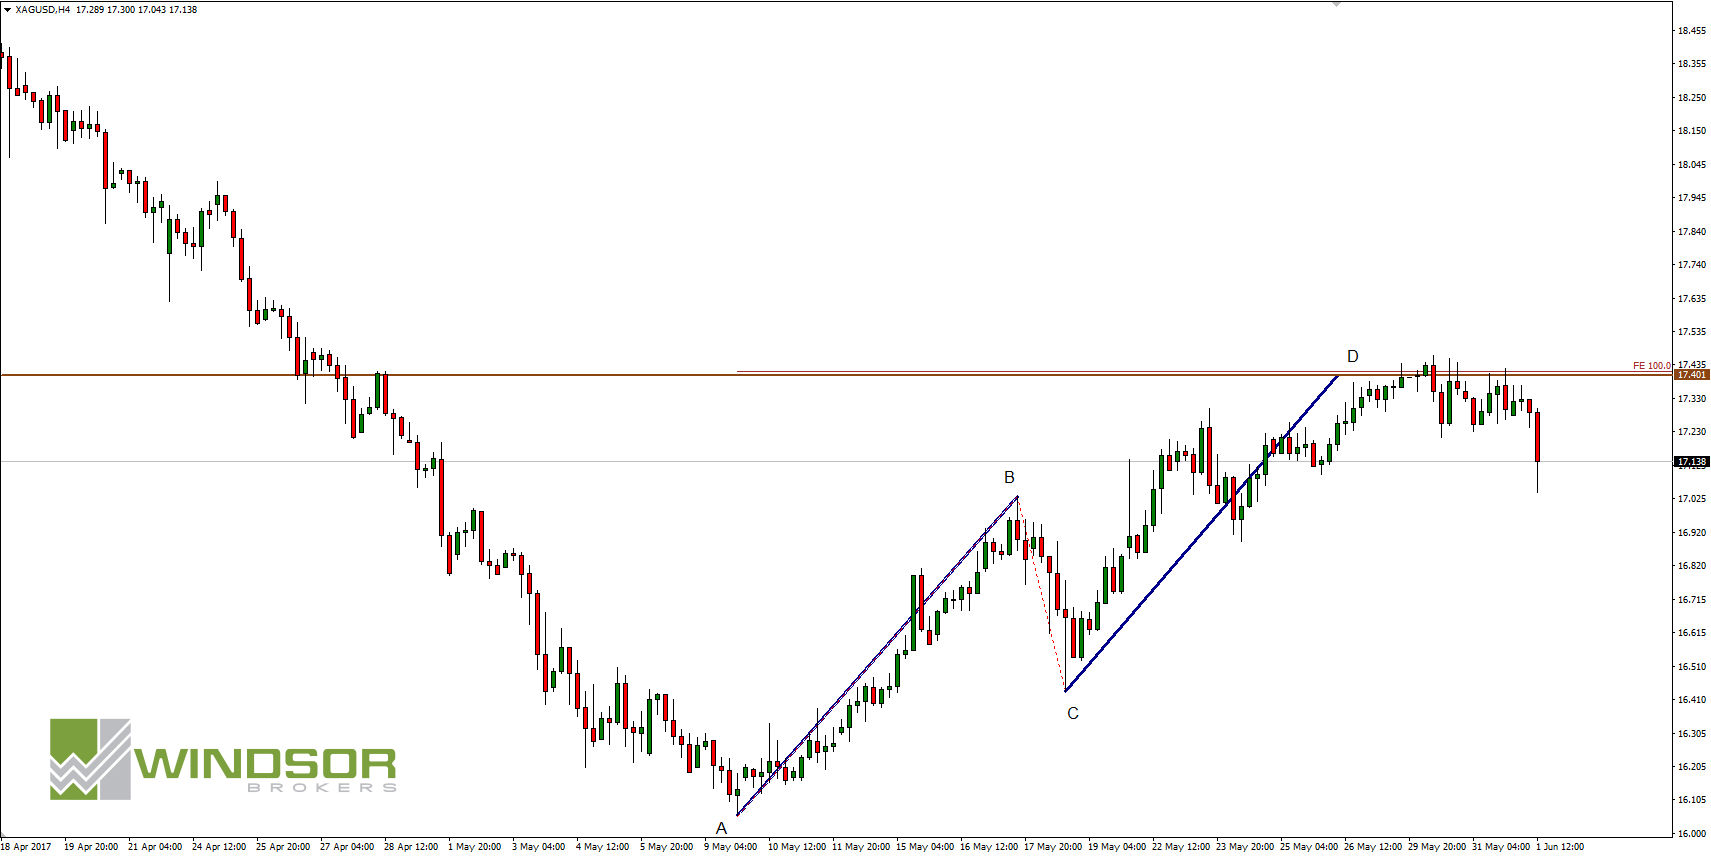
Last Friday I pointed out that there is high probability of decrease of silver price to 17.40. I showed ABCD pattern before it was even tested: “D point which should cause rebound is located at 17.40. The price was very close to that level today but silver didn’t test it yet”.
Decrease inside ABCD is happening
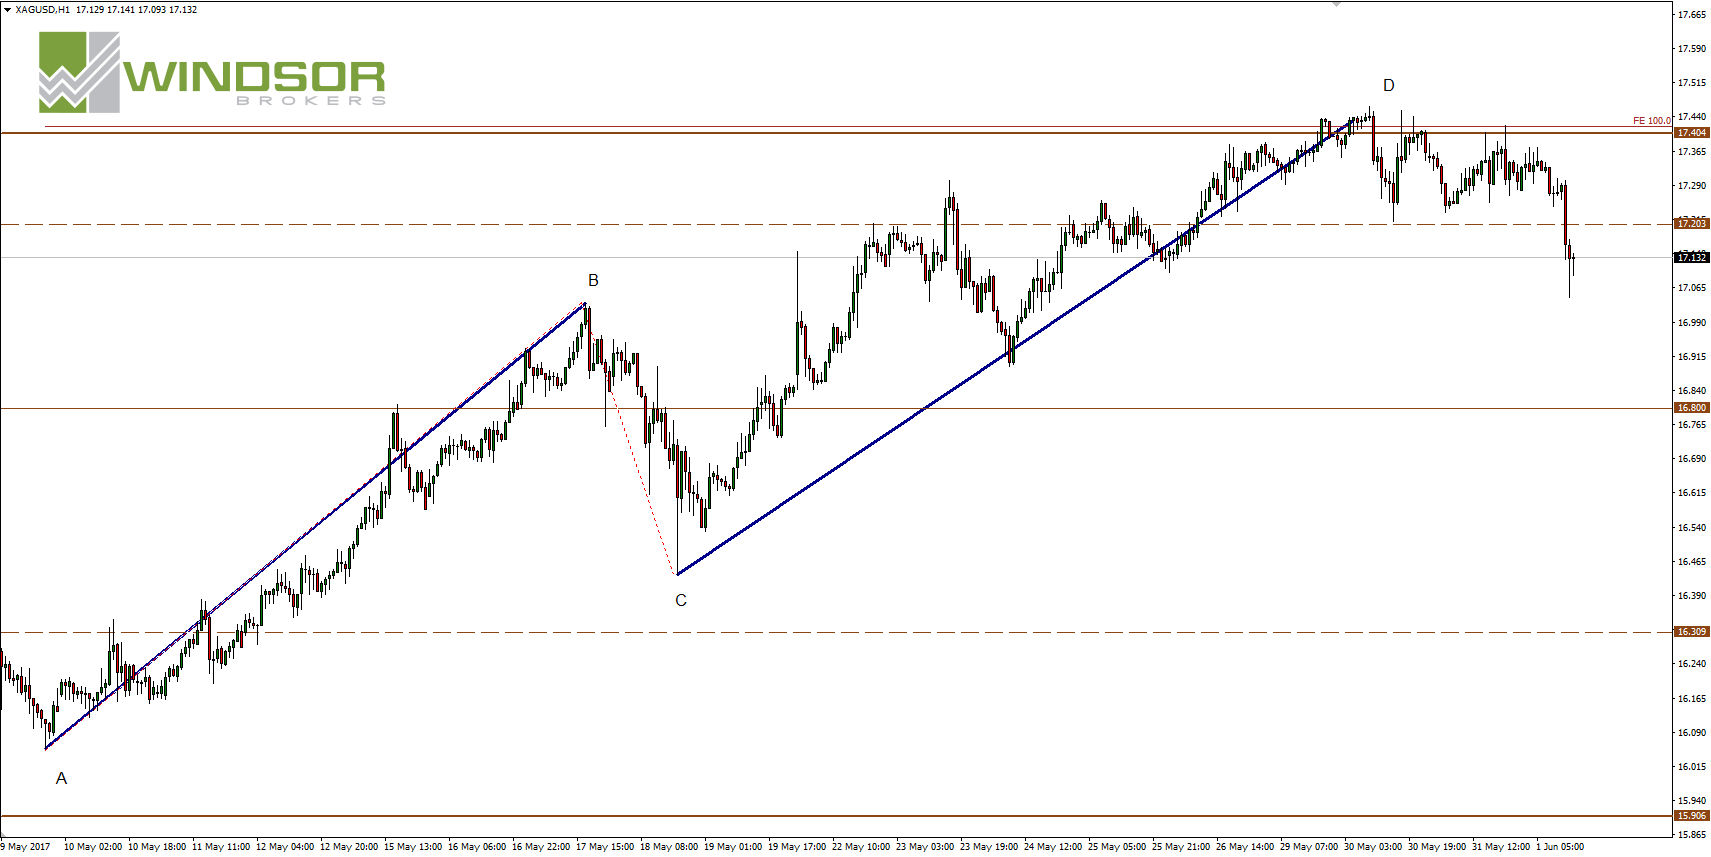
ABCD pattern on 17.40 made AB=CD and in D point there is also I resistance, which supports bears. This pattern is opposite to previous bearish trend and has a form of lear BC line. For 3 days (From Monday to Wednesday) bulls tried to break 17.40. It did not happen and as a result on Thursday price took control. There was dynamic bearish movement and now price is at 7 days low.
In short term we should expect dynamic moves which shows up after moving down to BC range. Depending on strength of bears price should stop in 17.00-16.500 area. There should be bullish correction.
In middle term decreases can be continued with testing of May’s lows. This would happen according to our bearish scenario from April 17th – May 9th.