Last week I pointed to a potential harmonic formation on the EURPLN pair. If the CD was equal to AB, it would be a classic straightforward correction that is highly effective. However, as long as the 4.3130 test is not sure, the formation may never be formed (more in the analysis “potential ABCD formation on EURPLN”). In the end of the article you can see current EURPLN chart.
Another formation from last week was the ascending BAT pattern. According to my predictions, the D point of formation was tested for the second time, and even GBPJPY slightly exceeded the Fibo abolition of 88.6%. However, there was a rapid increase and as a result, GBPJPY was today on highest level since 17 August.
GBPJPY gains after failing to break point D of the BAT formation
On the GBPJPY chart we see a fully formed BAT formation. In this case, the formation predicts increases and in fact Monday was the third day of growth on GBPJPY. Point B of the formation fell in line with the rule of 38.2% correction of the stretch XA. Point C is located between points A – B and point D at 88.6%. The supply attempted to break point D, but the buyers immediately pushed the price on Monday to 11-day maximum.
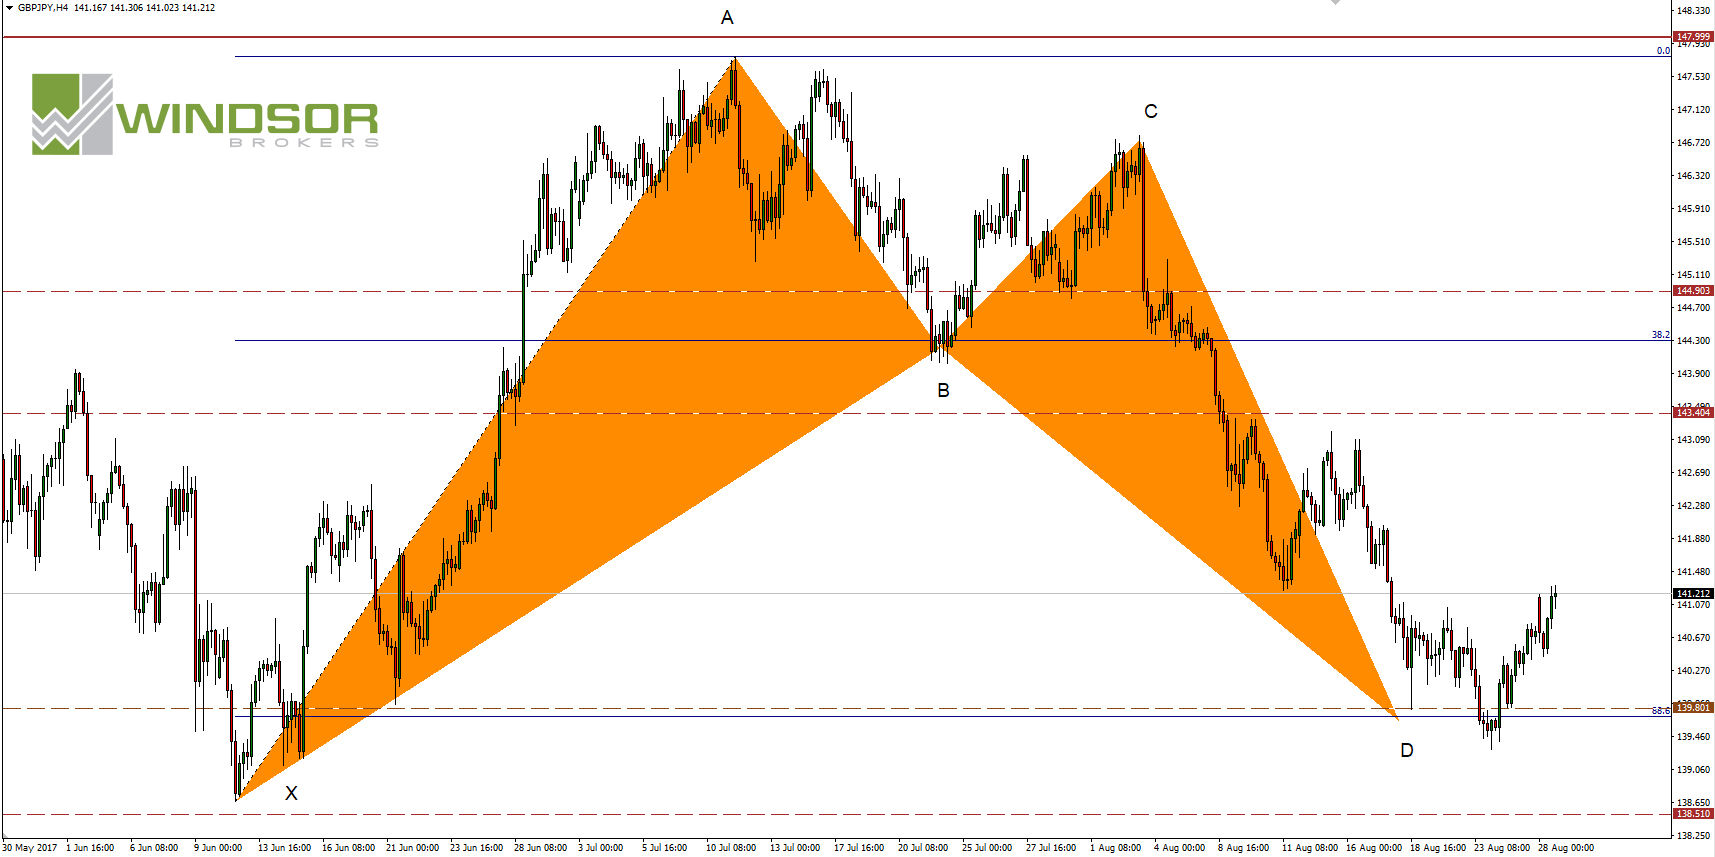
Currently the main scenario for GBPJPY is bullish movement. The first buyer’s goal will be 143.40 resistance and the next 144.90. Typically, the most dynamic increases take place in the B area, and so it would be safest to make a profit after the resistance test 143.40.
If there was another D-test this would be a bad signal for buyers. Breakpoints of D, ie negation of formation occur less often than reflections from them. However, if this is the case then usually this breakthrough is accompanied by a strong breaking candle on the H4 or D1 intervals. Therefore, an alternative scenario must also be considered.
The EURPLN is still awaiting the D test of the formation
The ABCD on EURPLN continues to remain a potential only formation. Perhaps it will have to wait longer, and maybe the price will not reach point D in the near future. The EURPLN chart looks currently as follows:


