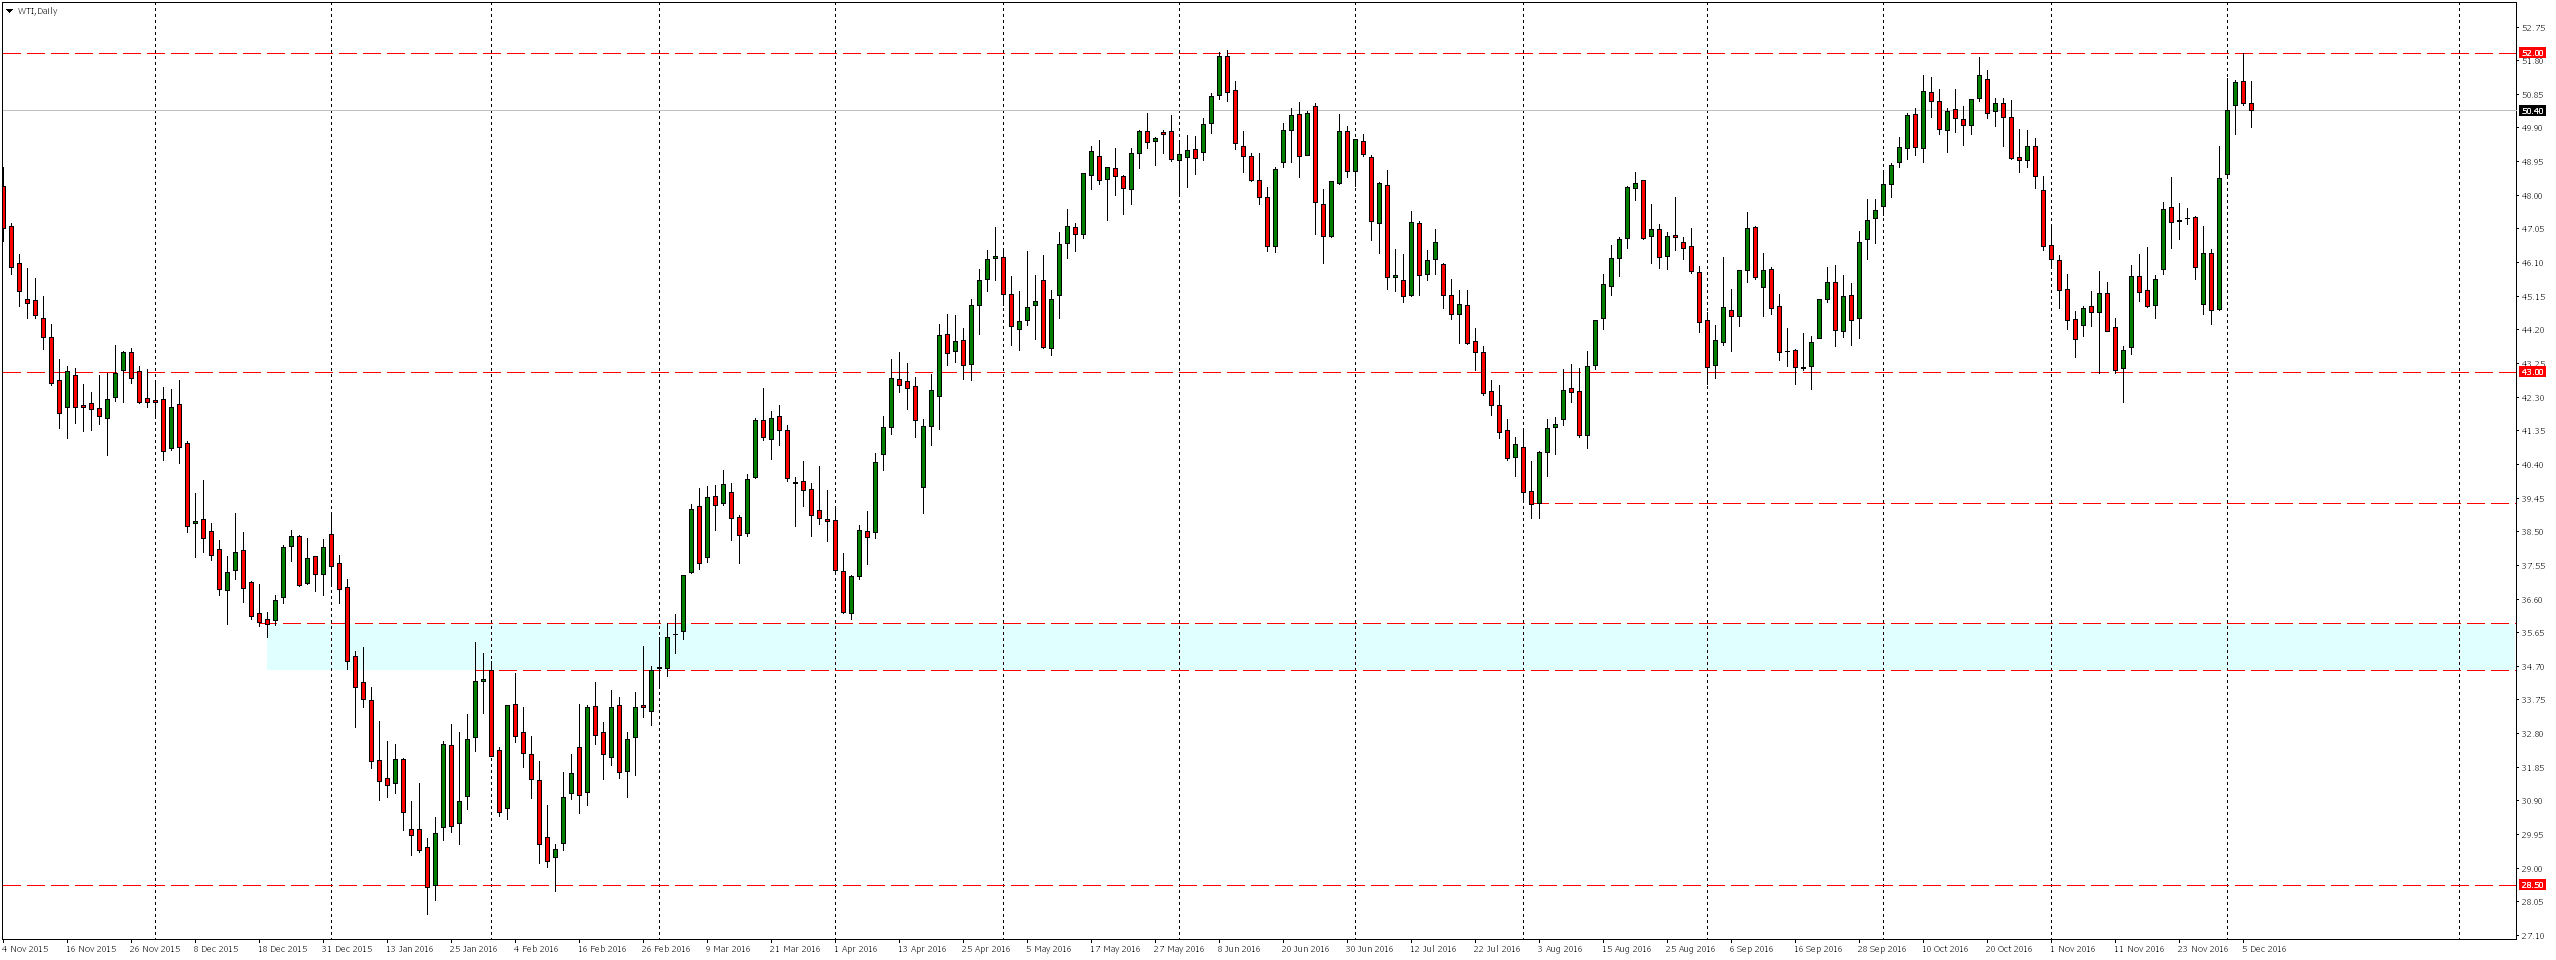
WTI crude oil reached yesterday vicinity of an important resistance 52.00. Perhaps it would be not surprising if not the fact that this level only this year was tested three times and each time stopped demand before continuing increases.
If this time will be similar – how deep declines can we expect?
Looking at the present situation on the daily chart we notice that the next important level of support is around level 43.00, which is also the lower band of lasting for four months consolidation.
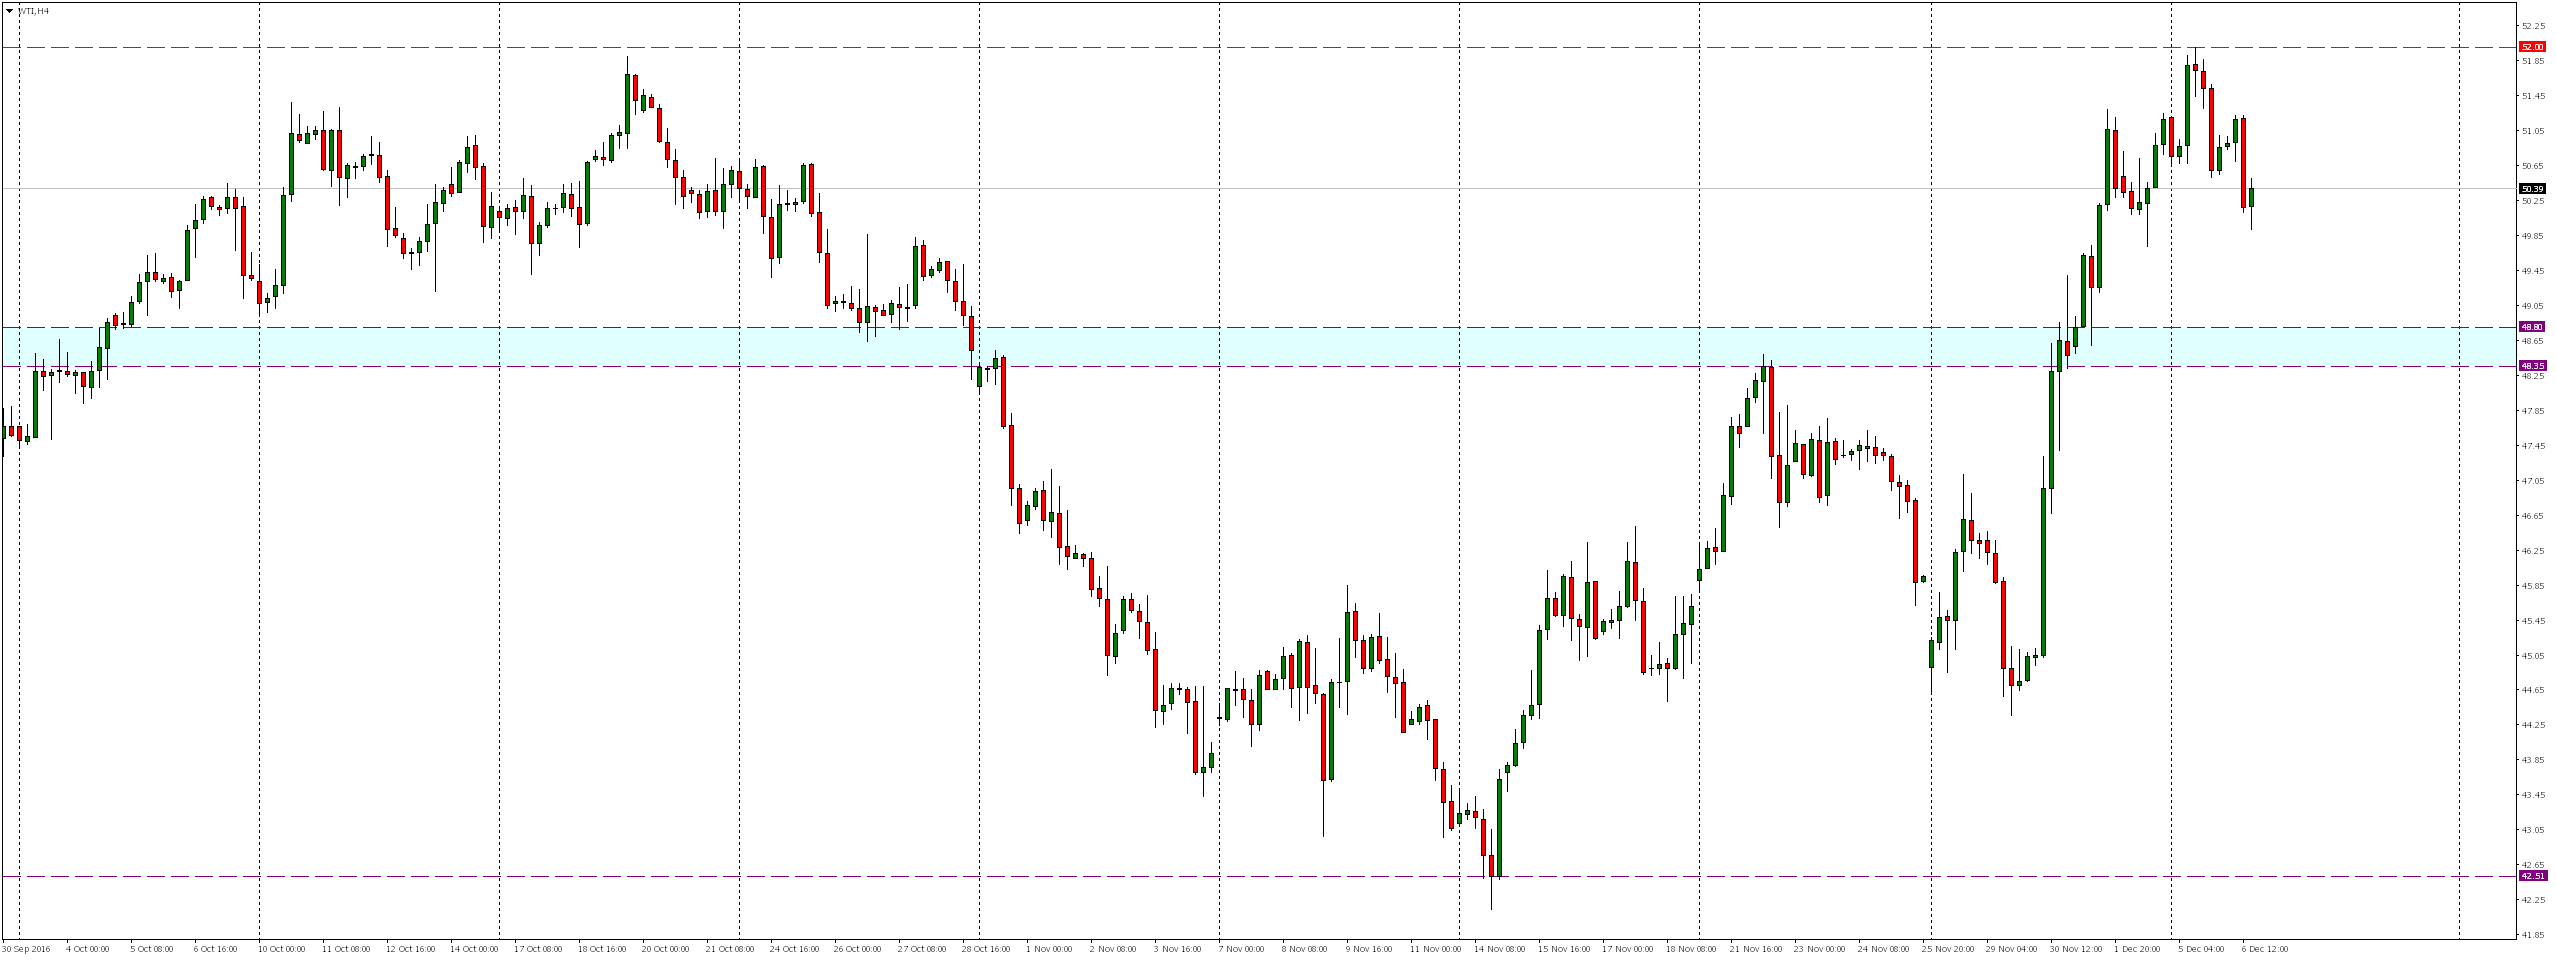
Looking at the chart H4 we notice that first reaction of demand we could expect much faster -already in the support area between levels 48.35 – 48.80.
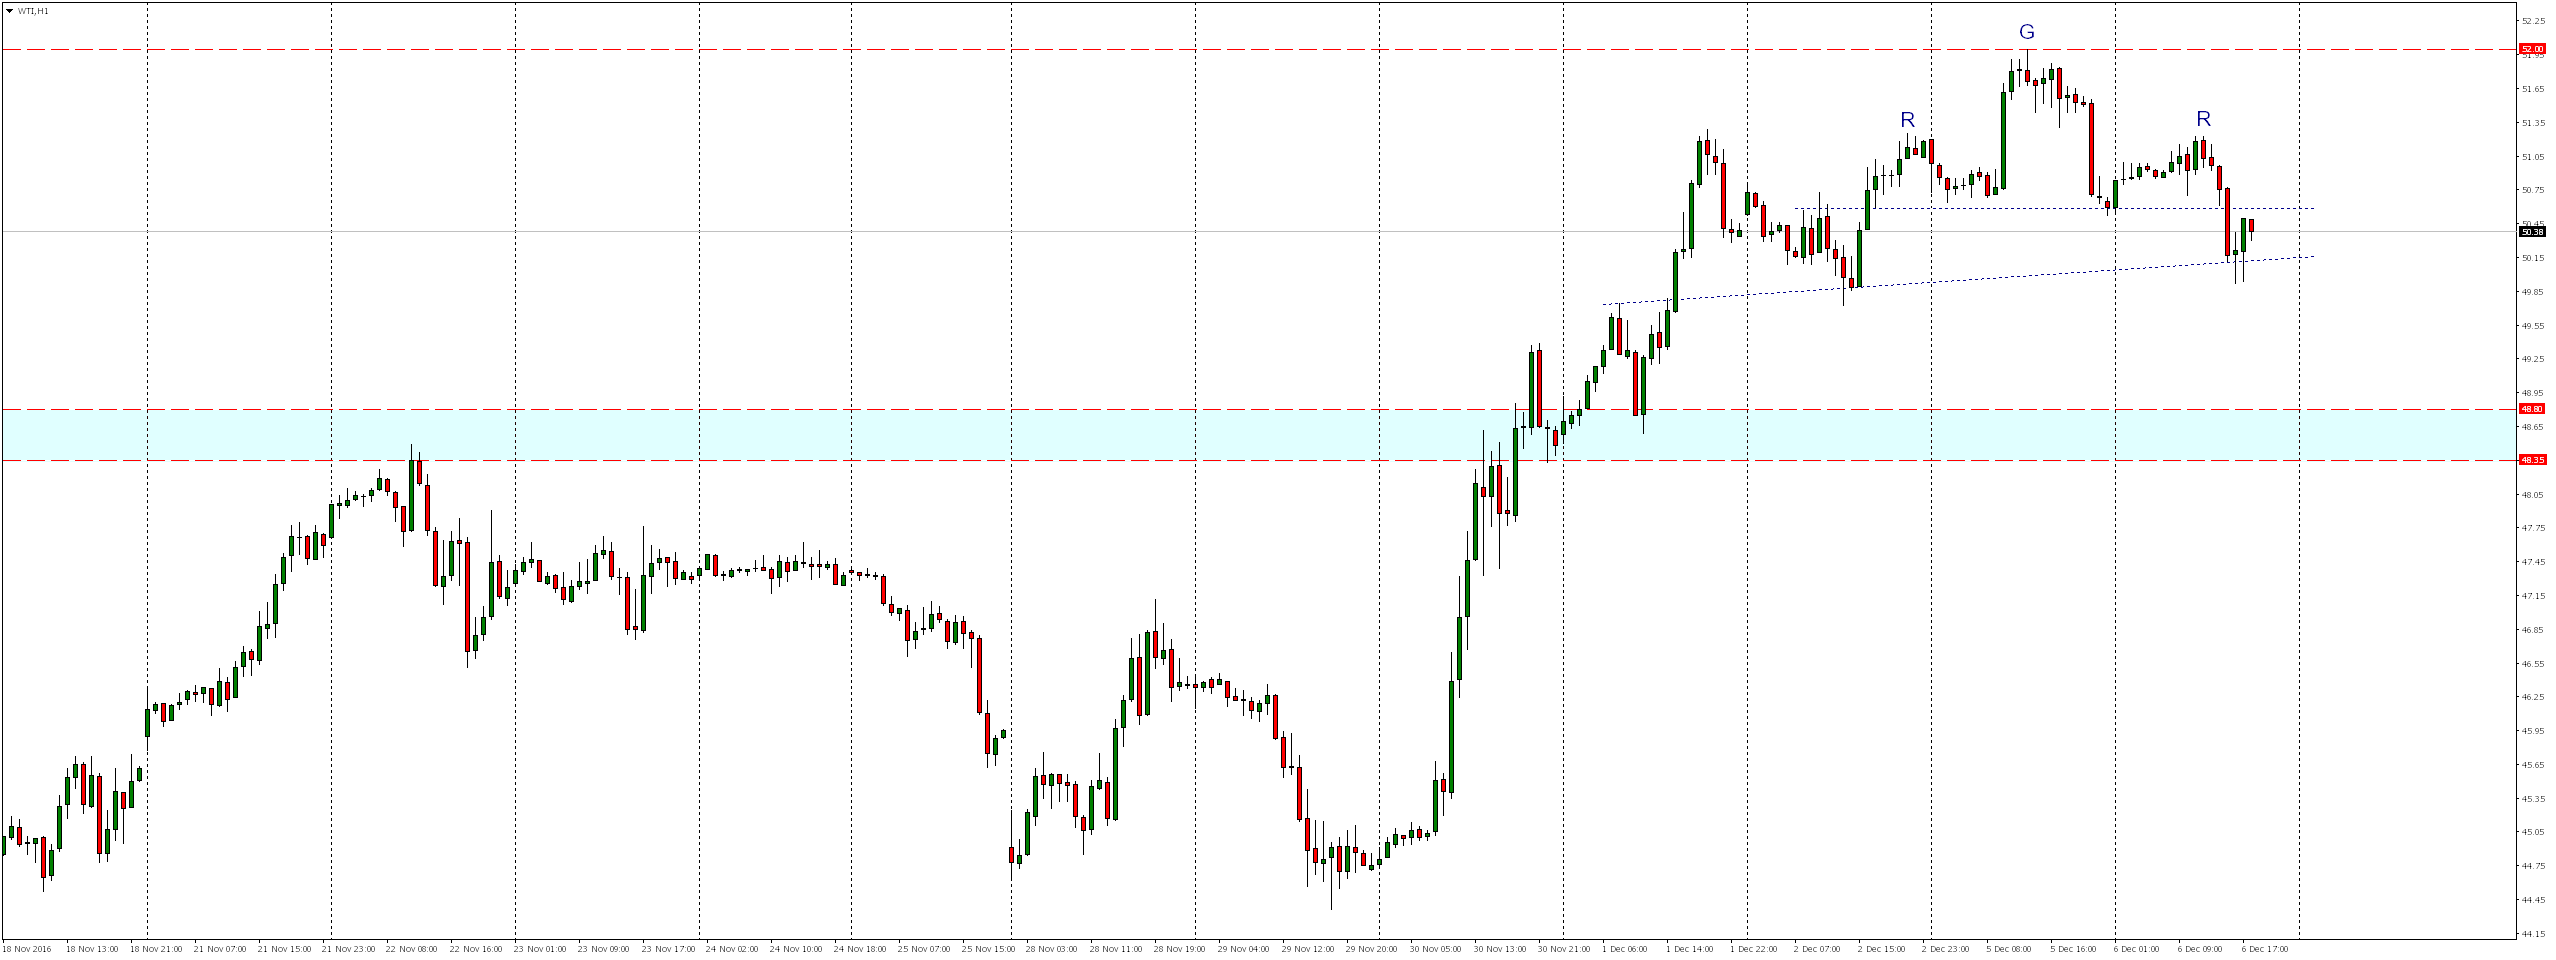
Such scenario is supported by the current situation on the graph H1, where a strong impetus to the downward defeated today the neck line of formation Head and Shoulders before price reached the line of upward trend. Overcoming this support (today’s lows) could open way to further declines in the vicinity of the aforementioned demand zone .