EURUSD
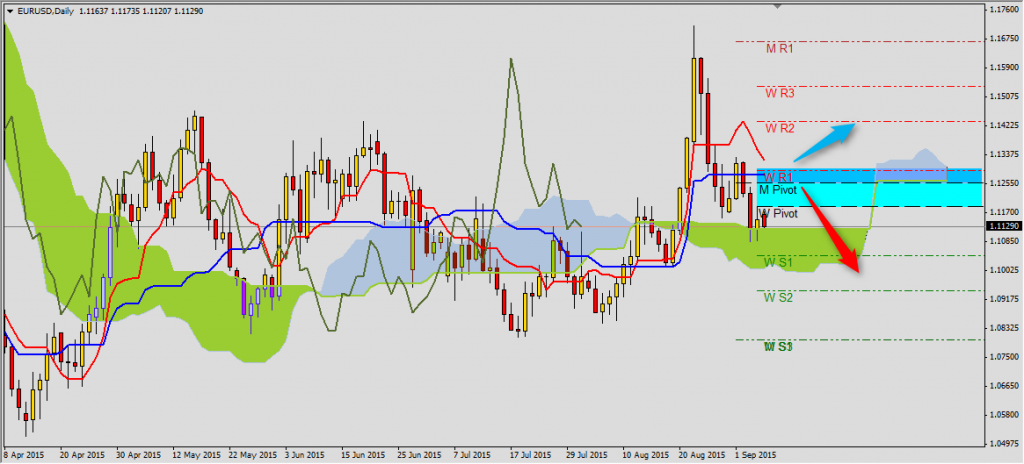
It is new week, so we should take a look on new Ichimoku lines in realtion to pivots, so we could have better view of market in nearest sessions. On EURUSD chart we can see important resistance at 1.1255, where Senkou Span B covers monthly pivot. Until price is below thip price and weekly pivot at 1.1186 the most probably scenario is continuation of downward tendency to weekly S1 1.1044 and S2 1.0942. Breaking Kijun-sen 1.1280 and Tenkan-sen 1.1323 will mean setting new minimum on EURUSD and possibility of going up to weekly R2 1.1434.
USDJPY
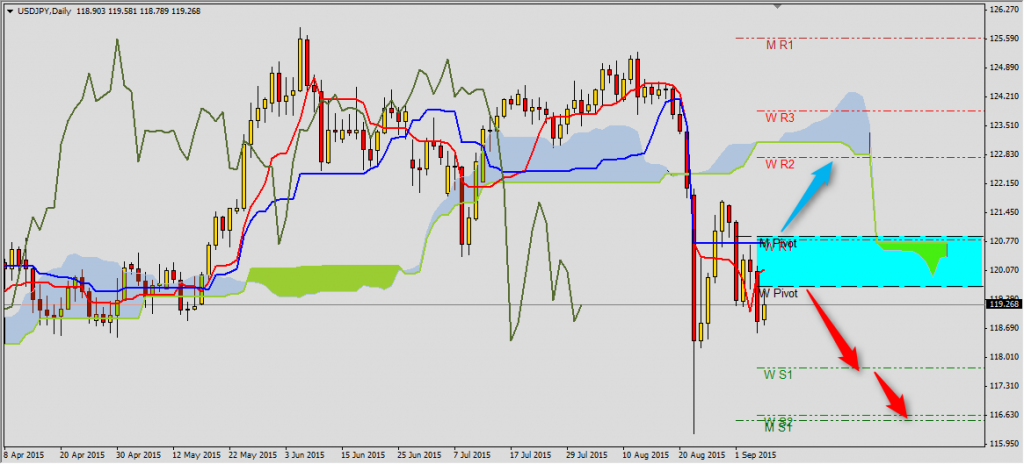
There is clear situation on USDJPY. Below resistance area 120.09-119.69, made from Tenkan-sen and weekly pivot, we have downtrend with range S1 117.75 and S2 116.62. Above 120.73-120.88 (Kijun-sen and monthly pivot) back to growth with possible weekly range R2 122.76. Between these areas there is consolidation, however Ichimoku lines prefer first scenario.
USDCAD
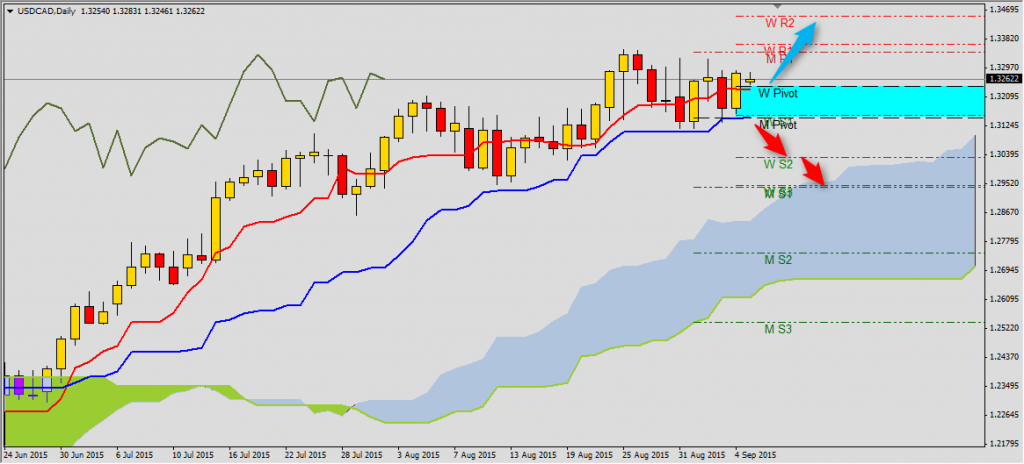
On USDCAD dominating trend is still upward with potential ranges R1 1.3366 and R2 1.3349. However we should always consider plan B. It would be drop of the price below Kijun-sen and monthly pivot 1.3151. Then we would have correction to S2 1.3030. The closest support for USDCAD is Tenkan-sen 1.3232.


