NZDUSD
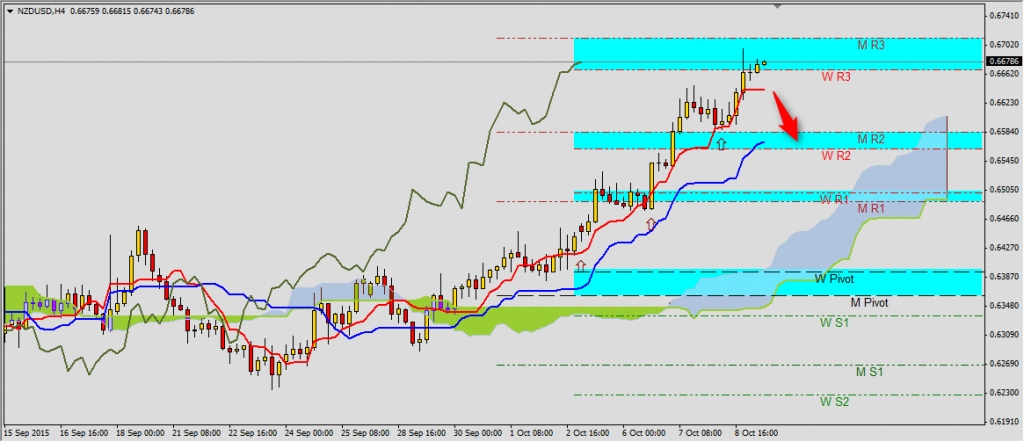
For whole week NZDUSD stays in strong bullish trend breaking another resistances set by weekly and monthly pivots. Today price is between weekly and monthly R3 0.6668-0.6711. It can predict correction soon on this pair and close of the candle below Tenkan-sen 0.6641 on H4 chart will be sell signal. First support area is set by Kijun-sen 0.6591. Unless price stay above 0.6501 level (where is Senkou Span B and monthly R1), we should look for signals of correction ending and joining to dominating bullish trend.
YOU CAN TRADE USING ICHIMOKU STRATEGY WITH FREE FXGROW ACCOUNT.
EURJPY
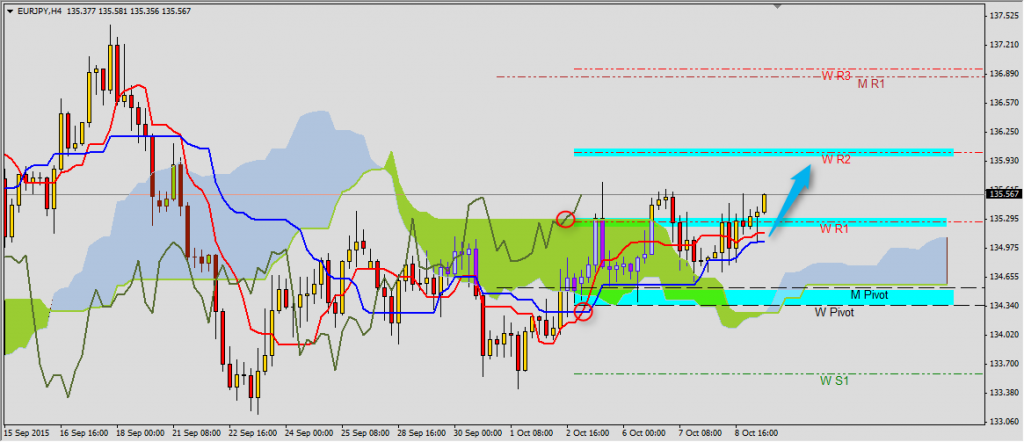
EURJPY is in side trend but with bullish tendency. For a week price stays above weekly and monthly pivot. Tenkan-sen stays above Kijun-sen and this area (135.15-130.05) is first support area. Range is set by weekly R2 136.02. Kumo changed color to bullish and Chikou Span is above chart and broke up from cloud what confirms this scenario.


