 Ichimoku is an investment strategy of trend following, it works great on H4, D1 and higher time frames. In this series of articles I present my setups and observations using Ichimoku, supports and resistances and Price Action patterns. You can also check previous Ichimoku overview.
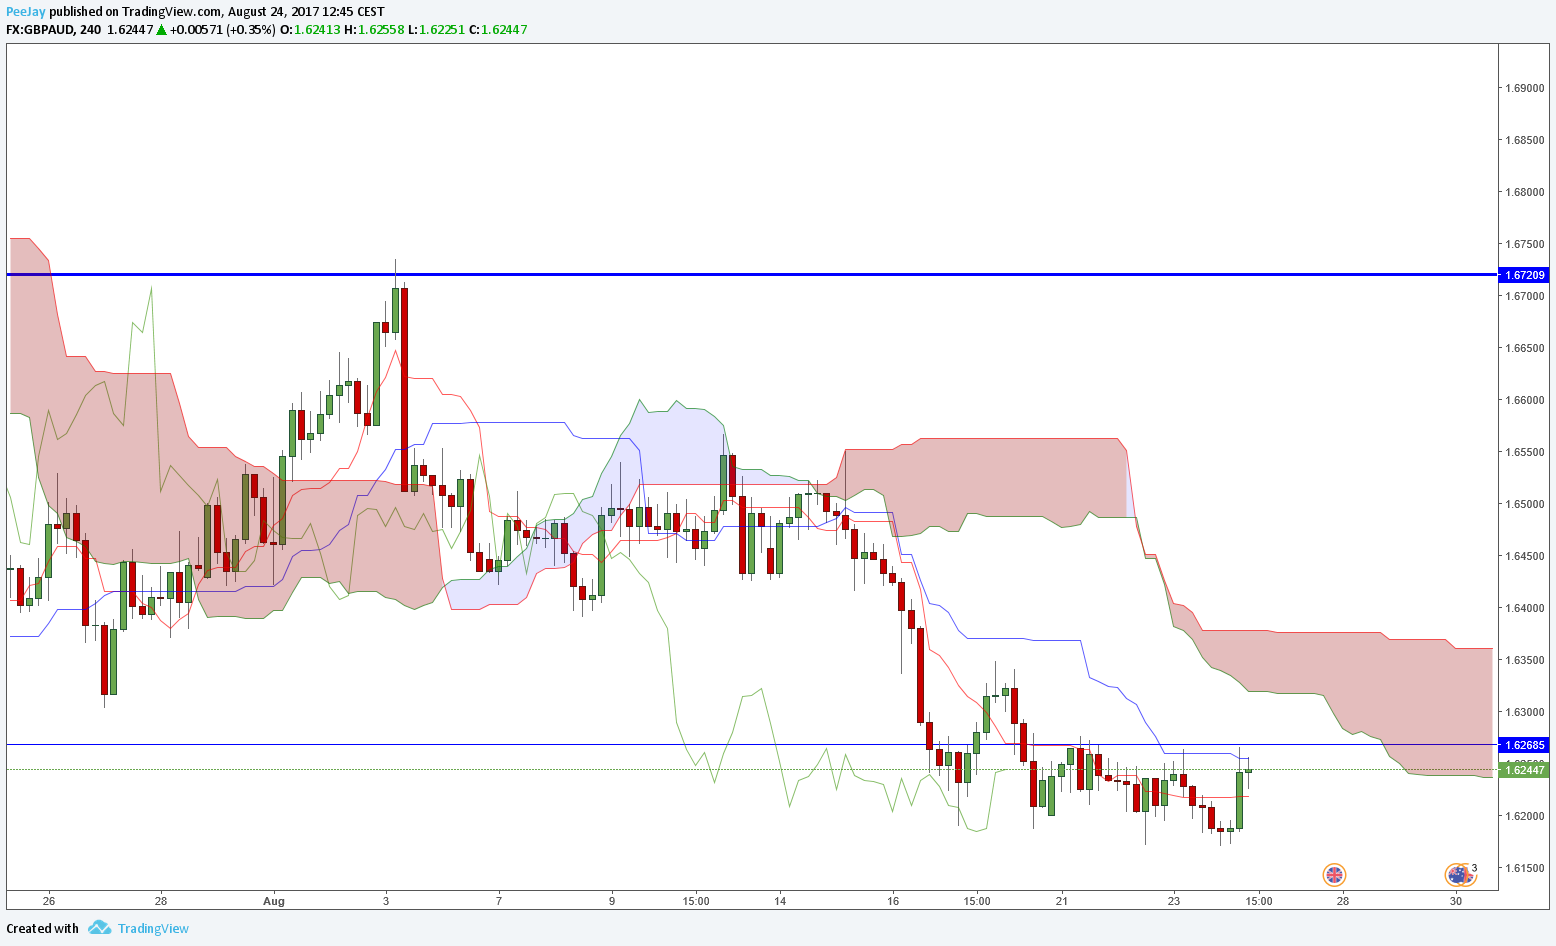
GBPAUD
On H4 chart we can see small slowdown of last decreases. Price recently broke through the support in 1.6270 area and currently few times tested this level from below. Last few bullish candles gave us great opportunity to open short position with better RR.
Bearish Kumo cloud is getting bigger and Tenkan is below Kijun what indicates further depreciation. We can place SL in the area of lower band of the cloud, thanks to that we have 100 pips of space.
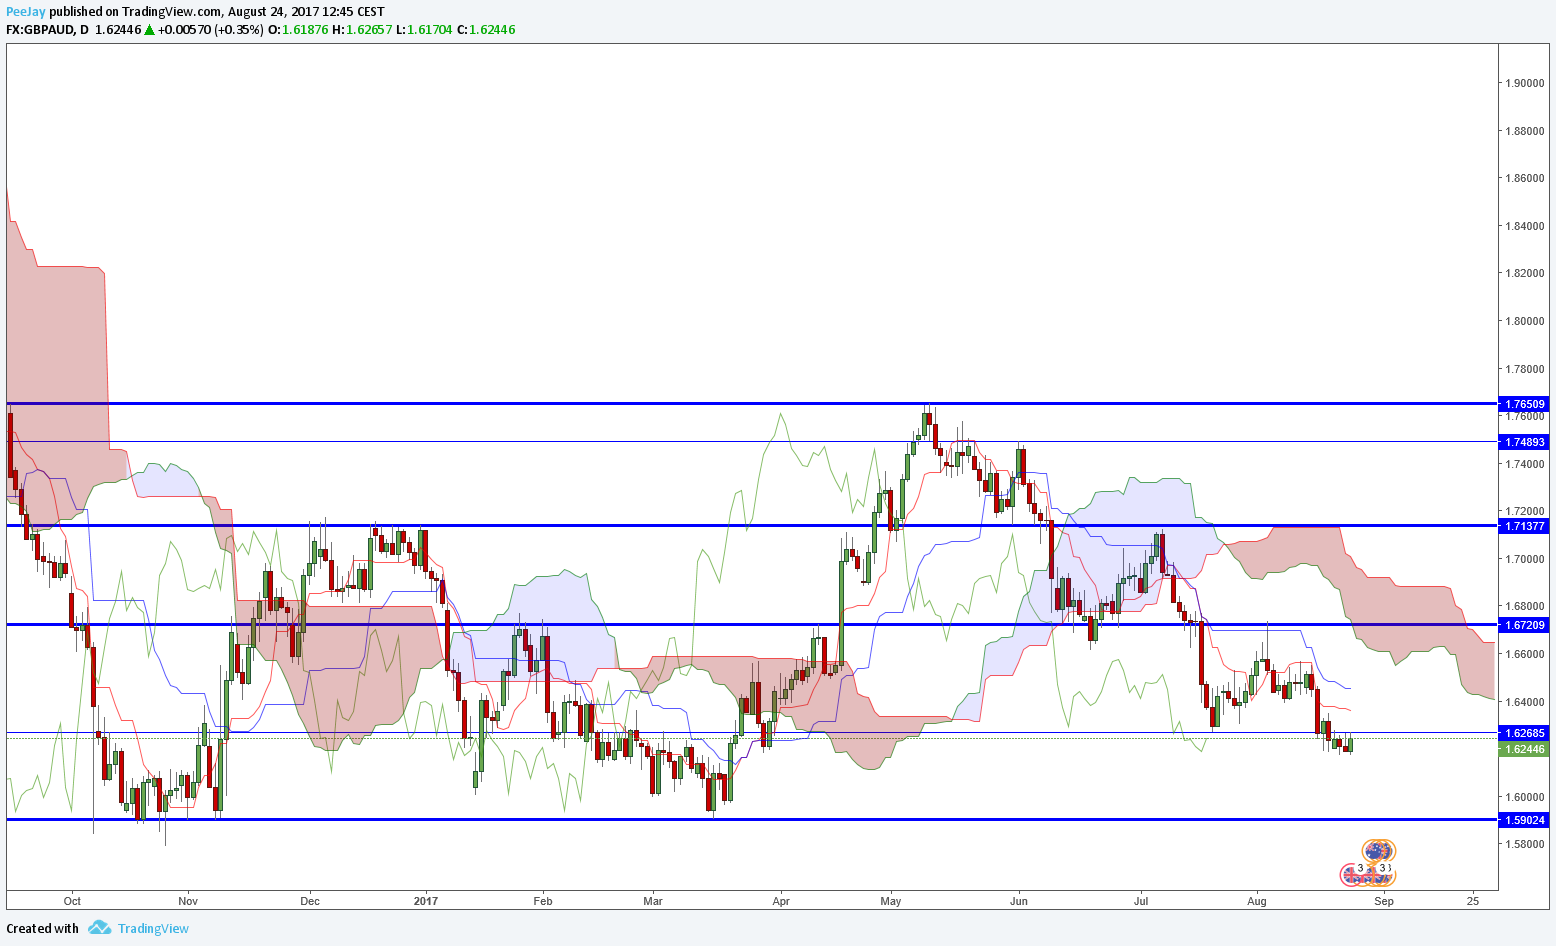
To define Take Profit level let’s take a look at daily chart. In the area of 1.59 there is a key support, we can put our target a little above it. Thanks to that we can get really nice RR – a little more than 4:1. I opened position on GBPAUD with FXTM account which offers quick order execution and funds security.
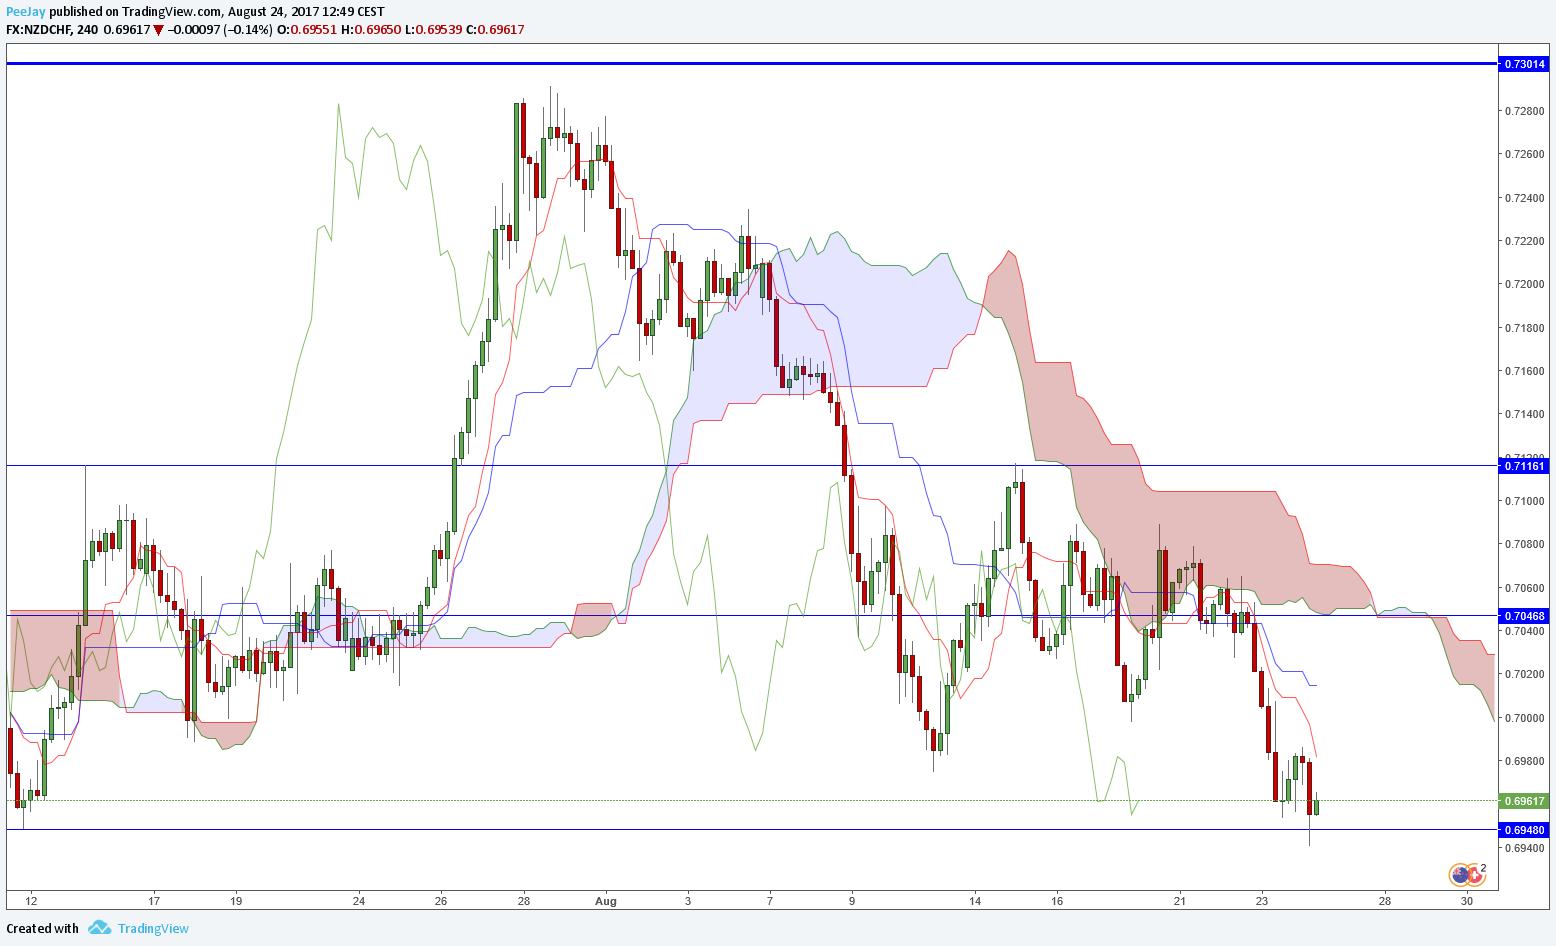
NZDCHF
On the H4 chart of NZDCHF we can see that price is slowly getting to support in 0.6950 area. If it will be broken, we can wait for the re-test and open short position. Kumo cloud is bearish and Tenkan line is way below Kijun.
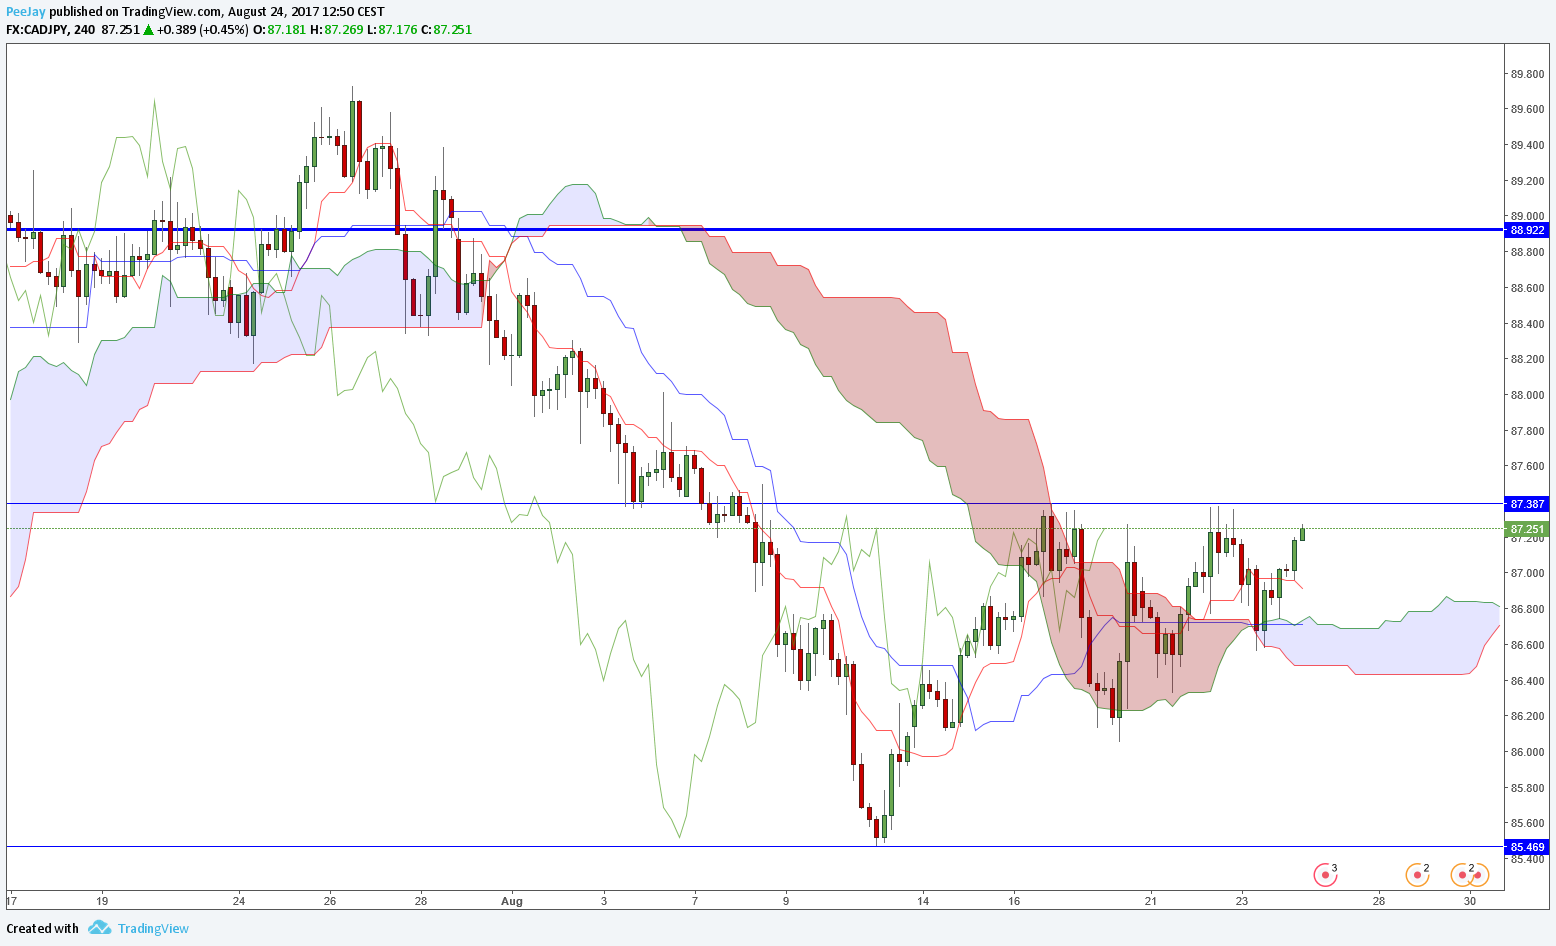
CADJPY
Price on H4 chart recently broke out of bullish Kumo and few candles earlier there was bullish cross of Tenkan and Kijun lines. Before we decide to open long position, we should wait for the break of resistance at 87.38, which stopped bulls two times already in the last 10 days.