![]()
![]() From Investor to Scalper – series of studies created in cooperation with broker BDSwiss, in which we take a financial instrument and the analysis includes a detailed look at the value from the monthly chart and ending with 5/15 minutes.
From Investor to Scalper – series of studies created in cooperation with broker BDSwiss, in which we take a financial instrument and the analysis includes a detailed look at the value from the monthly chart and ending with 5/15 minutes.
Currency pair AUDCHF for long time moves in a downward channel. Due to rejection of the lower limit of the formation in October 2015 we can observe growth which, if compared with the previous history of this instrument, seems to have very low dynamic.
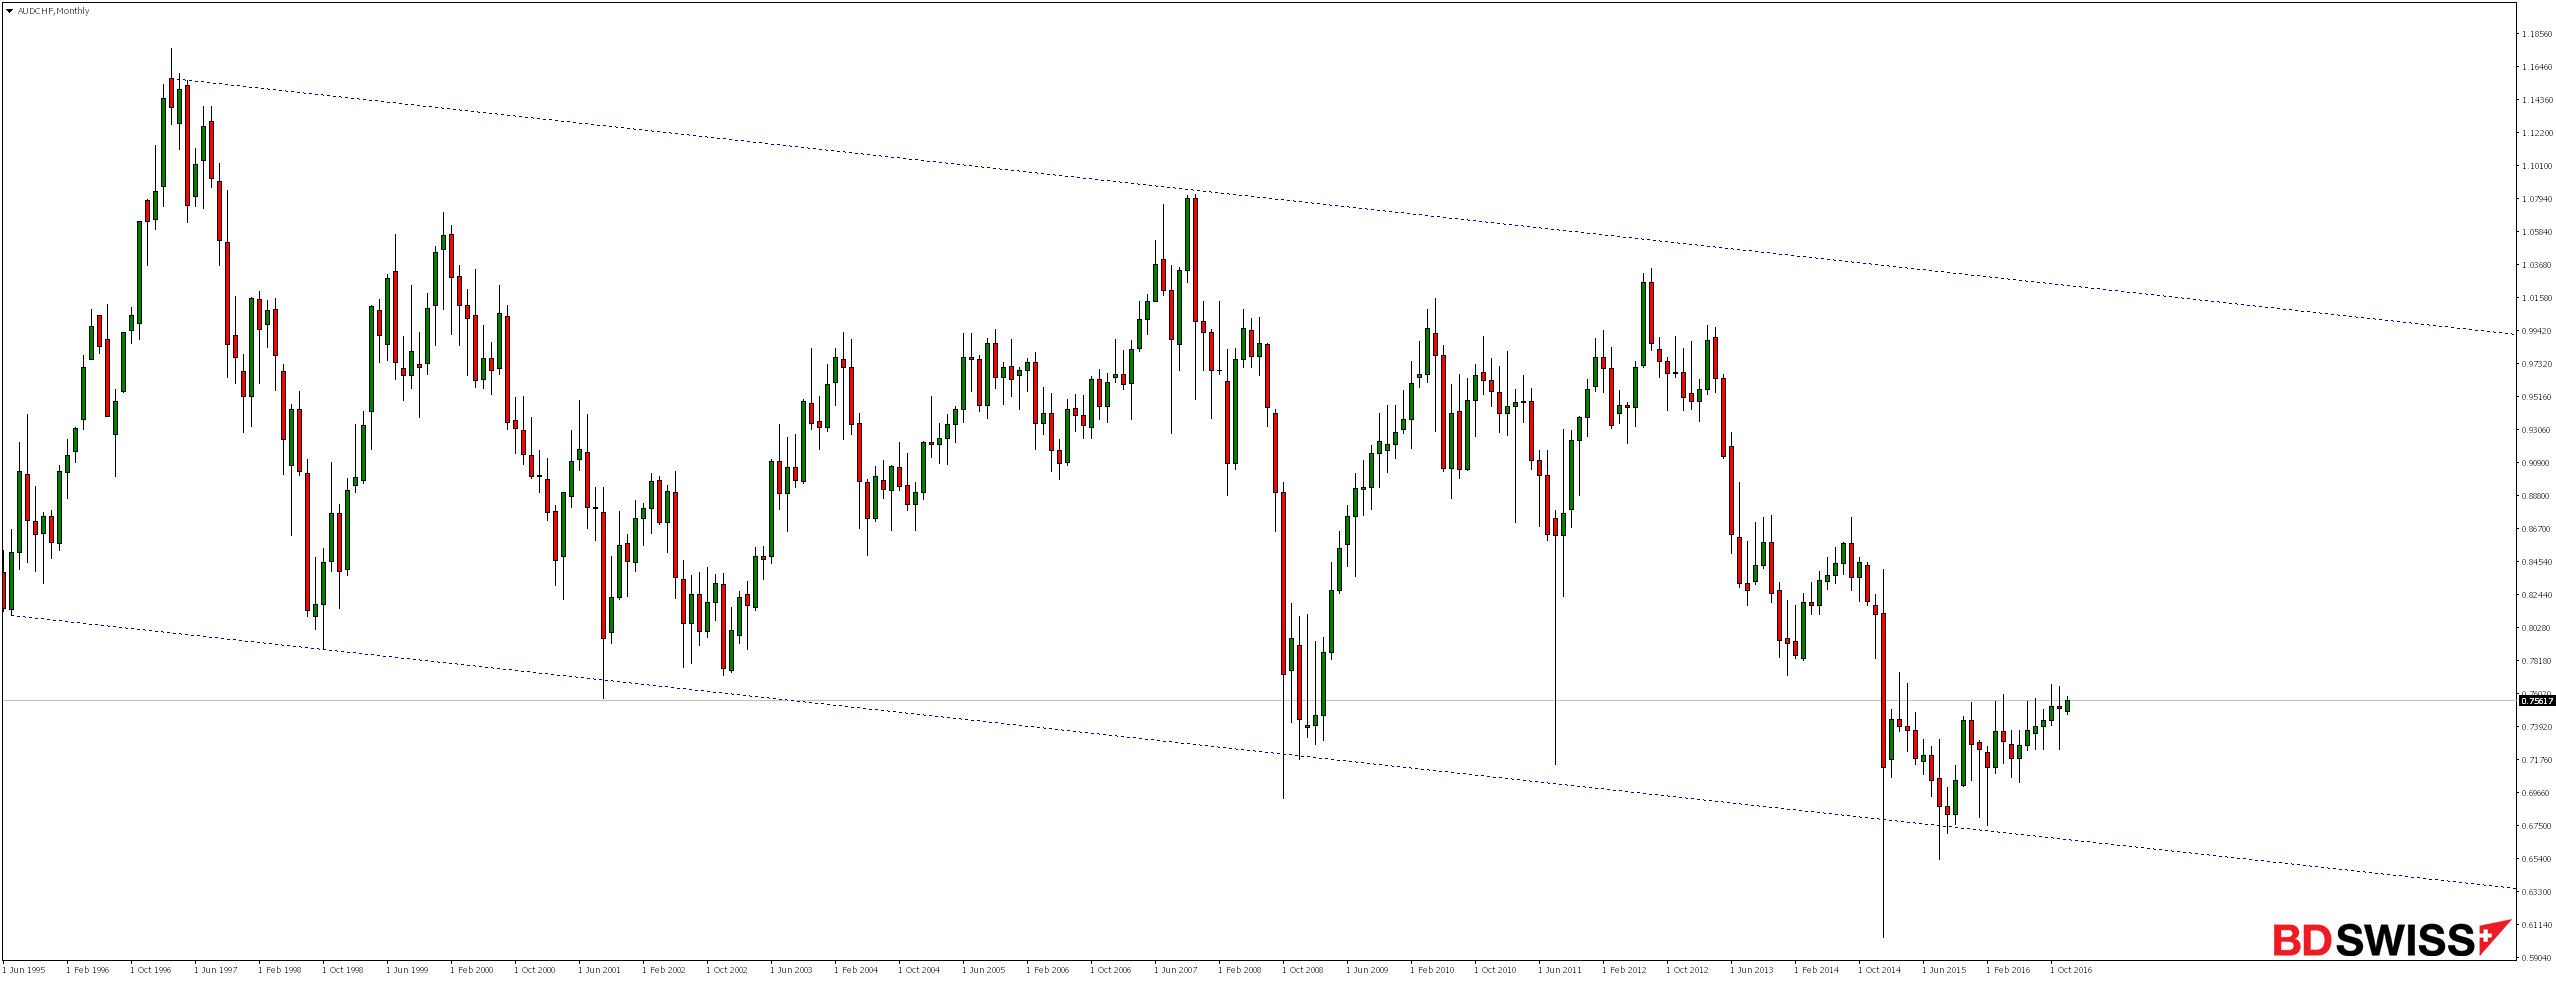
For nearly two years, and more particularly from the memorable “Black Thursday”, when there was a drastic and unexpected collapse of the market caused by the decision of the Swiss National Bank (SNB) to cut interest rates and abandon a fixed exchange rate of EUR / CHF at a height of 1.20 ,moves in consolidation creating triangle formation whose upper limit coincides with the level of 38.2% Fibonacci correction of the ongoing from August 2012 until January 2015 declines.
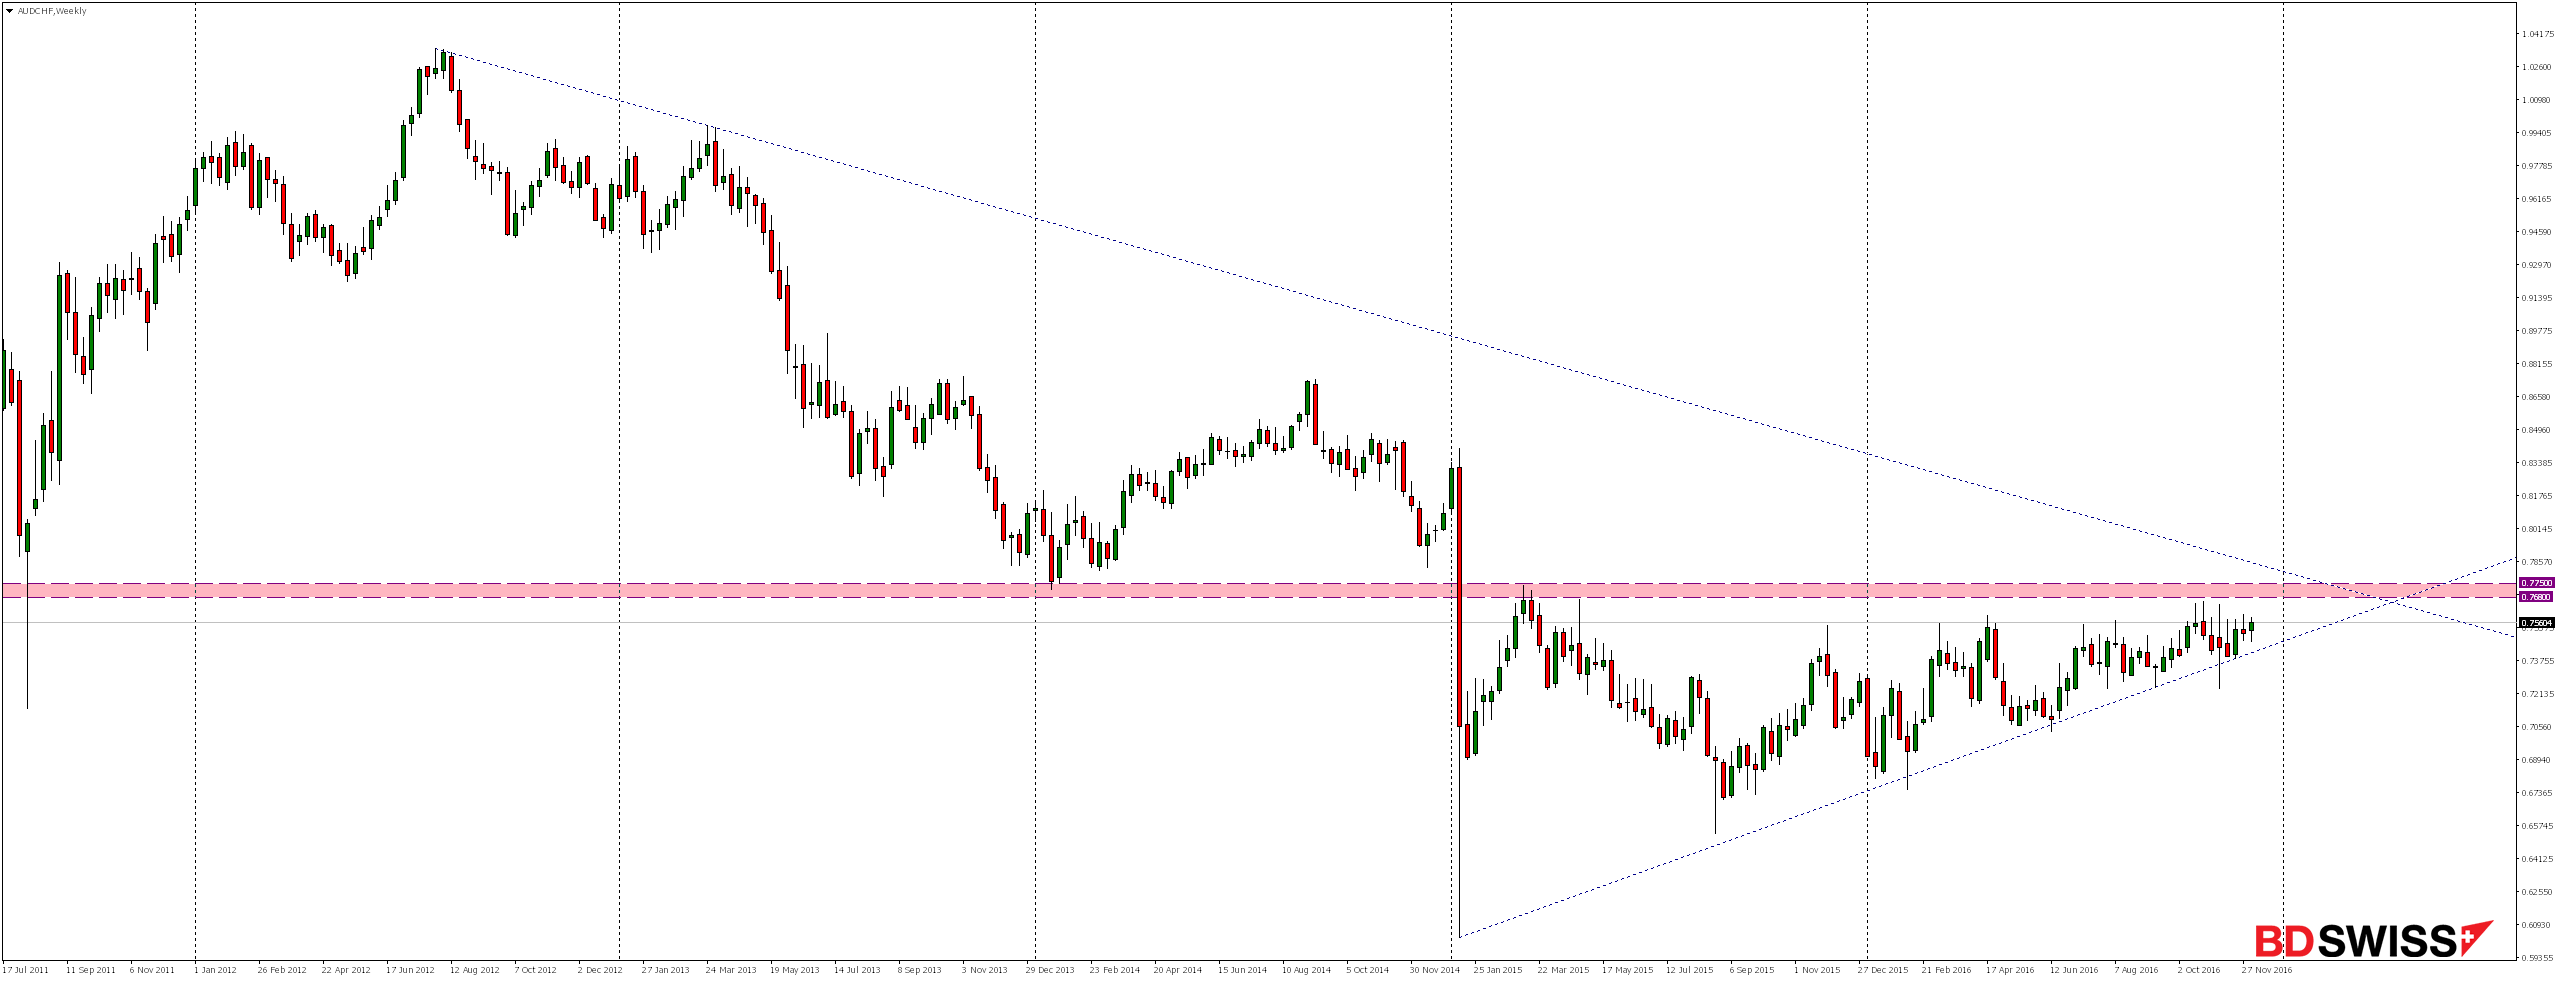
Looking at the weekly chart we see that the market is slowly approaching upper limit of the formation. From a technical point of view, it seems more probable, however, breaking the bottom but for such a scenario could be realized would be necessary to reject level around 0.7680.
Even if the market doesn’t break the triangle this year, from a technical point of view this should happen not later than April 2017r. when it will be fully constrict formation and has confluence with the bearish trend line.
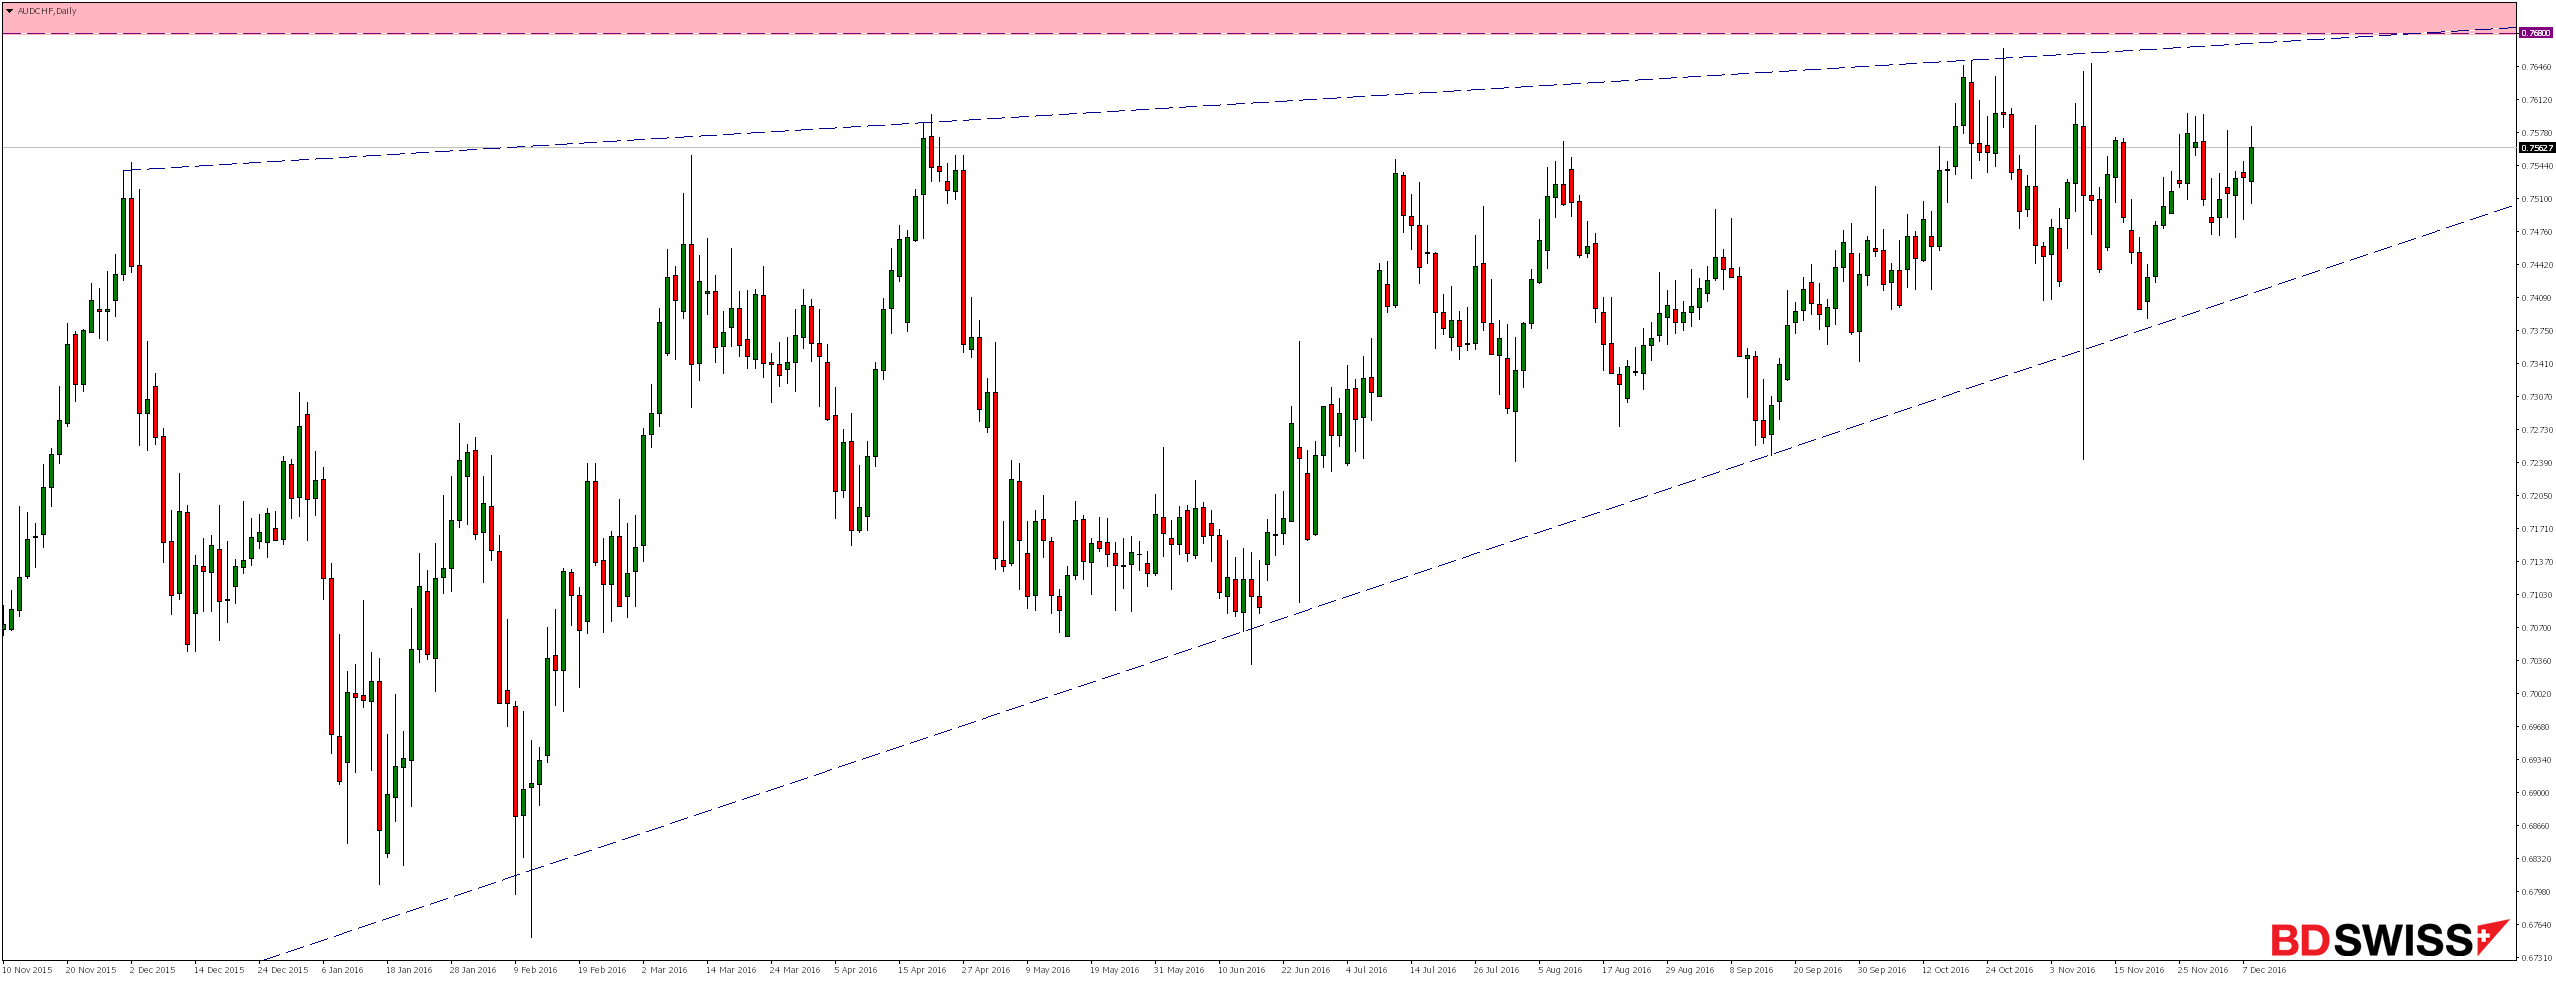
Looking at the daily chart we see that the market not only creates higher and higher lows but also higher tops and lasting from December last year movement creates a ascending wedge formation which is also more likely to be broken thru bottom.
If we look at the dynamics of each swing we will notice, that declines look much more like impulses and the increases are calmer and intertwined with both demand and supply candles -what may suggest that they are merely corrections.
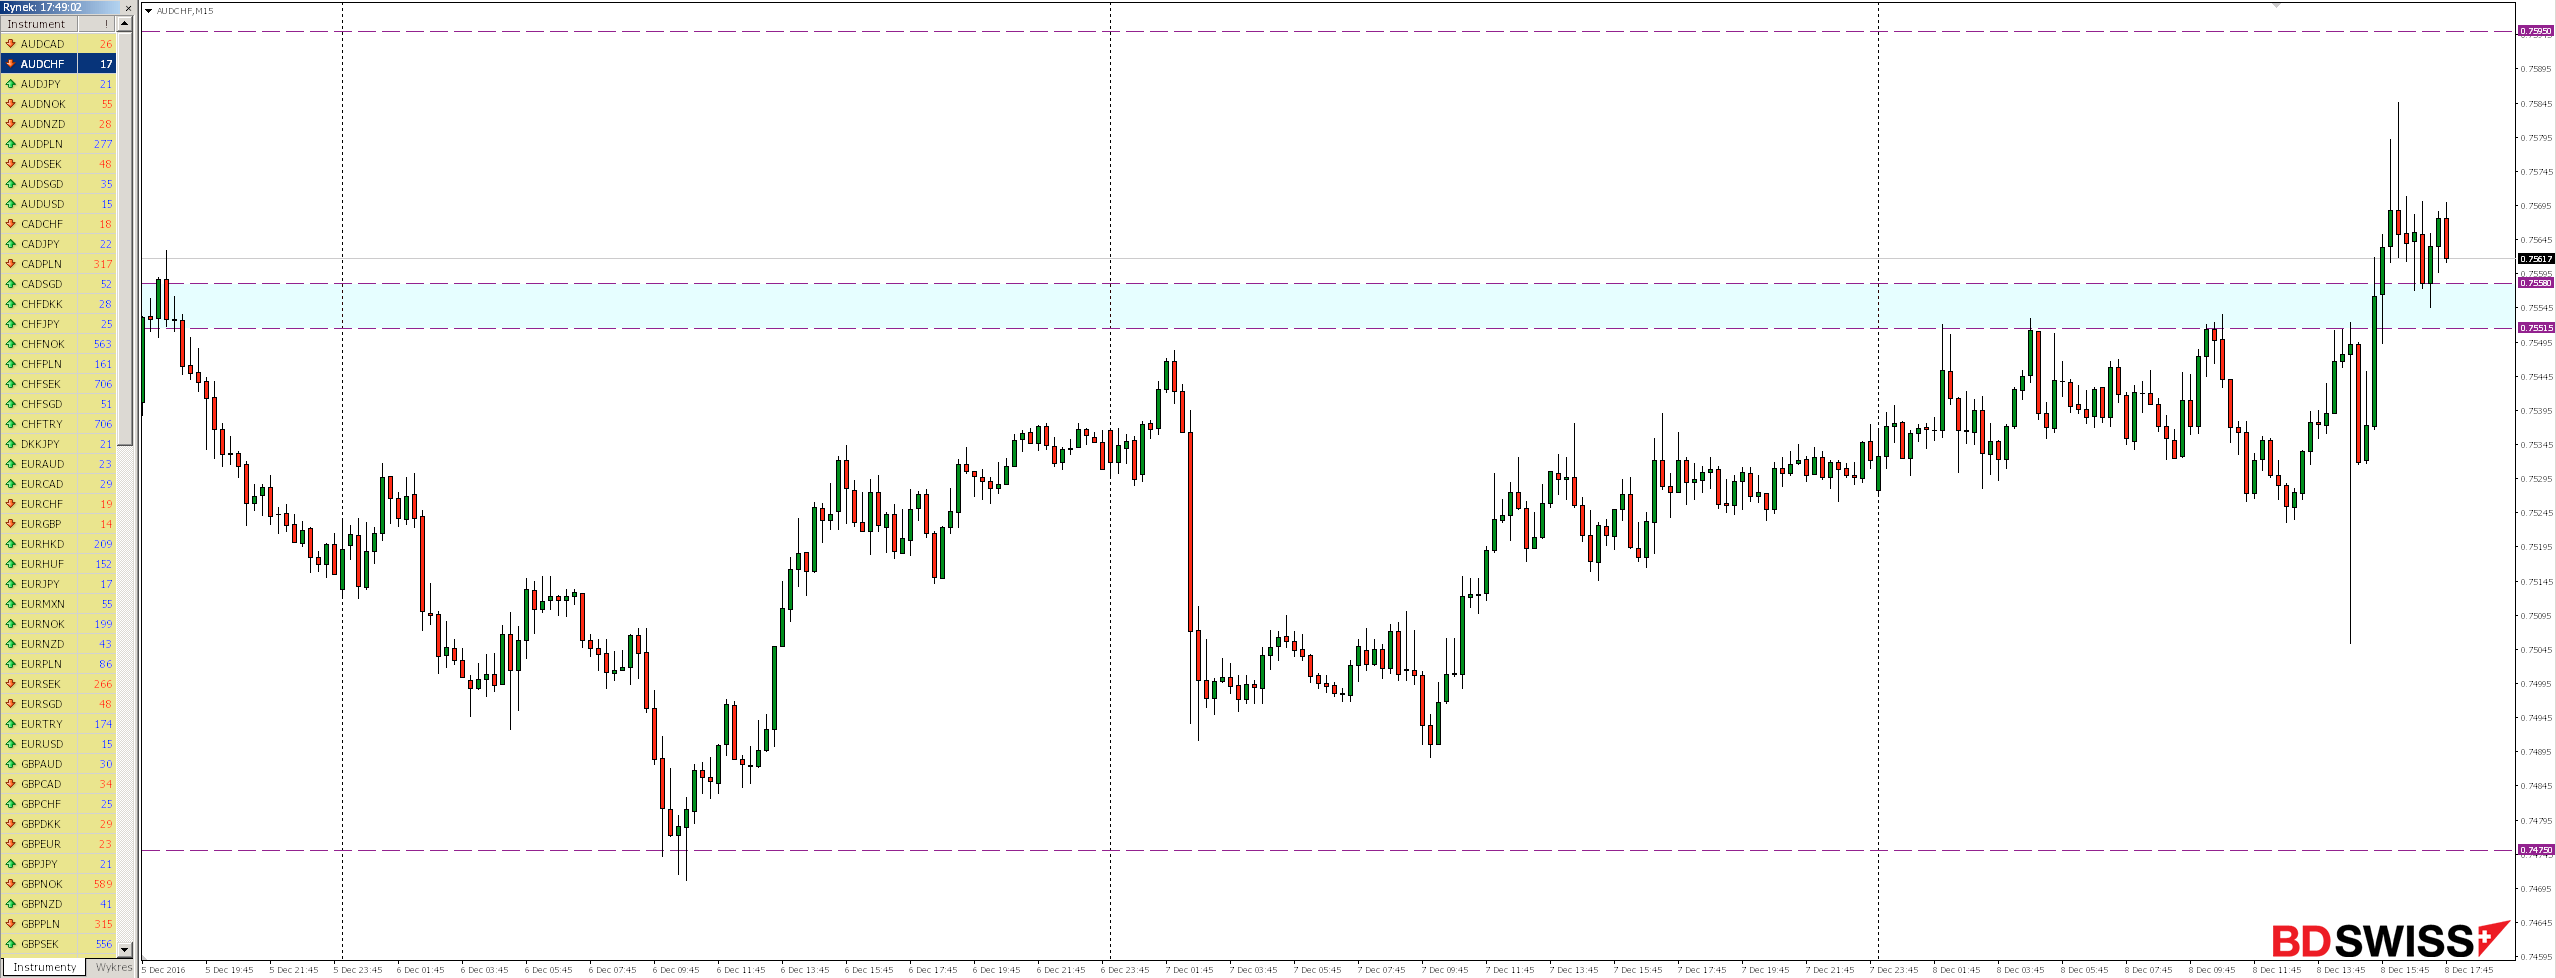
Looking at the daily chart we see that the market for several days and even weeks moves in consolidation between the levels of 0.7475 – 0.7595, and in the near future we expect the growth to reach vicinity of the upper limit of box.
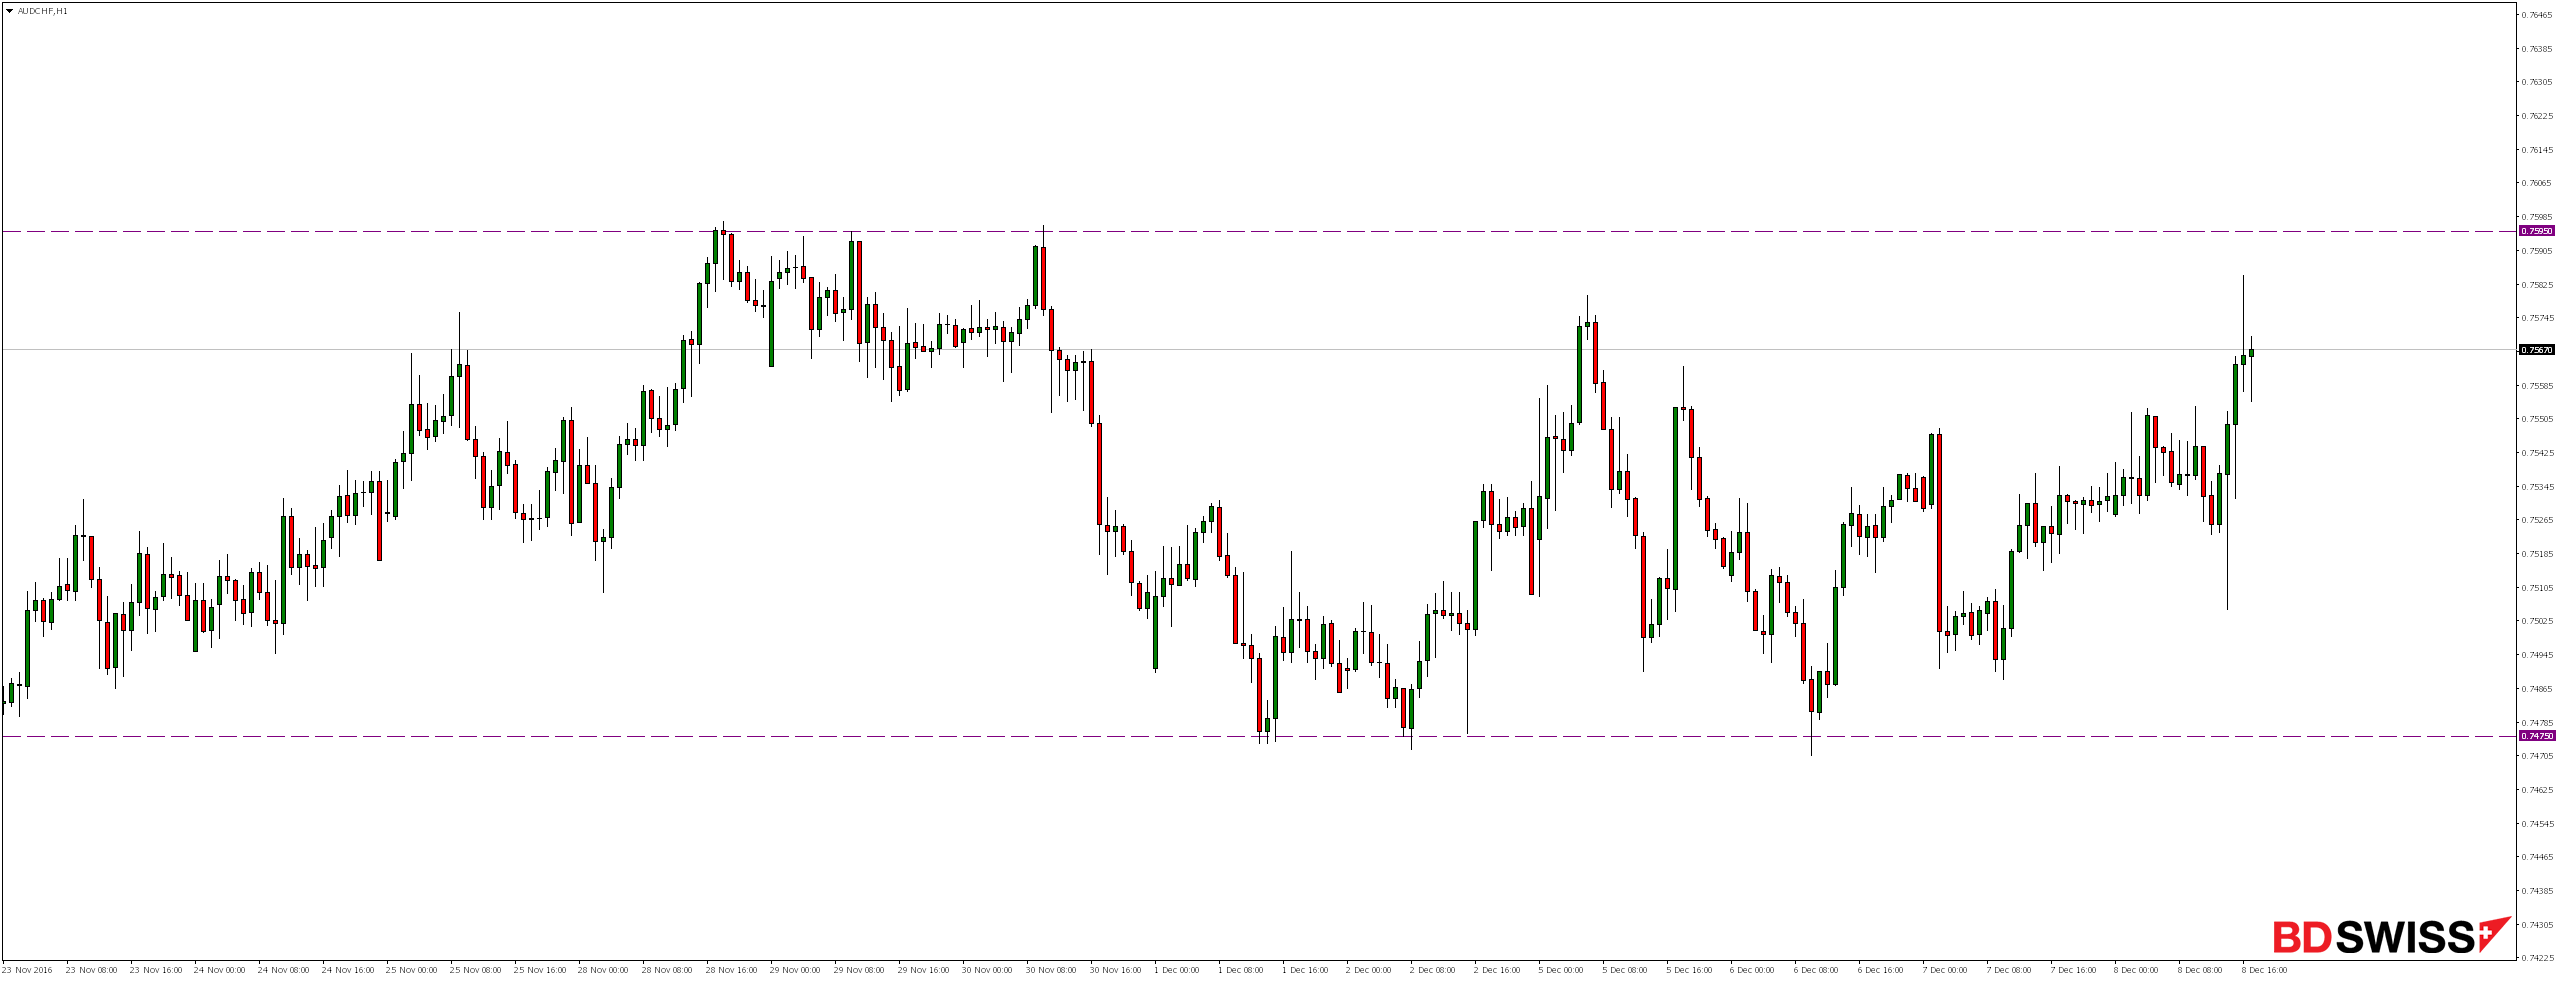
On the chart M15 we can see that today’s growth overcame the resistance level around 0.7558, which is now re-tested, and if only will be rejected from the top (as support), we expect continuation of growth in the vicinity of the aforementioned 0.7595 level.