From Investor to Scalper is a cycle of analysis in which we take one financial instrument and the analysis includes a detailed look at the value from the monthly/weekly chart to the H1/M15.
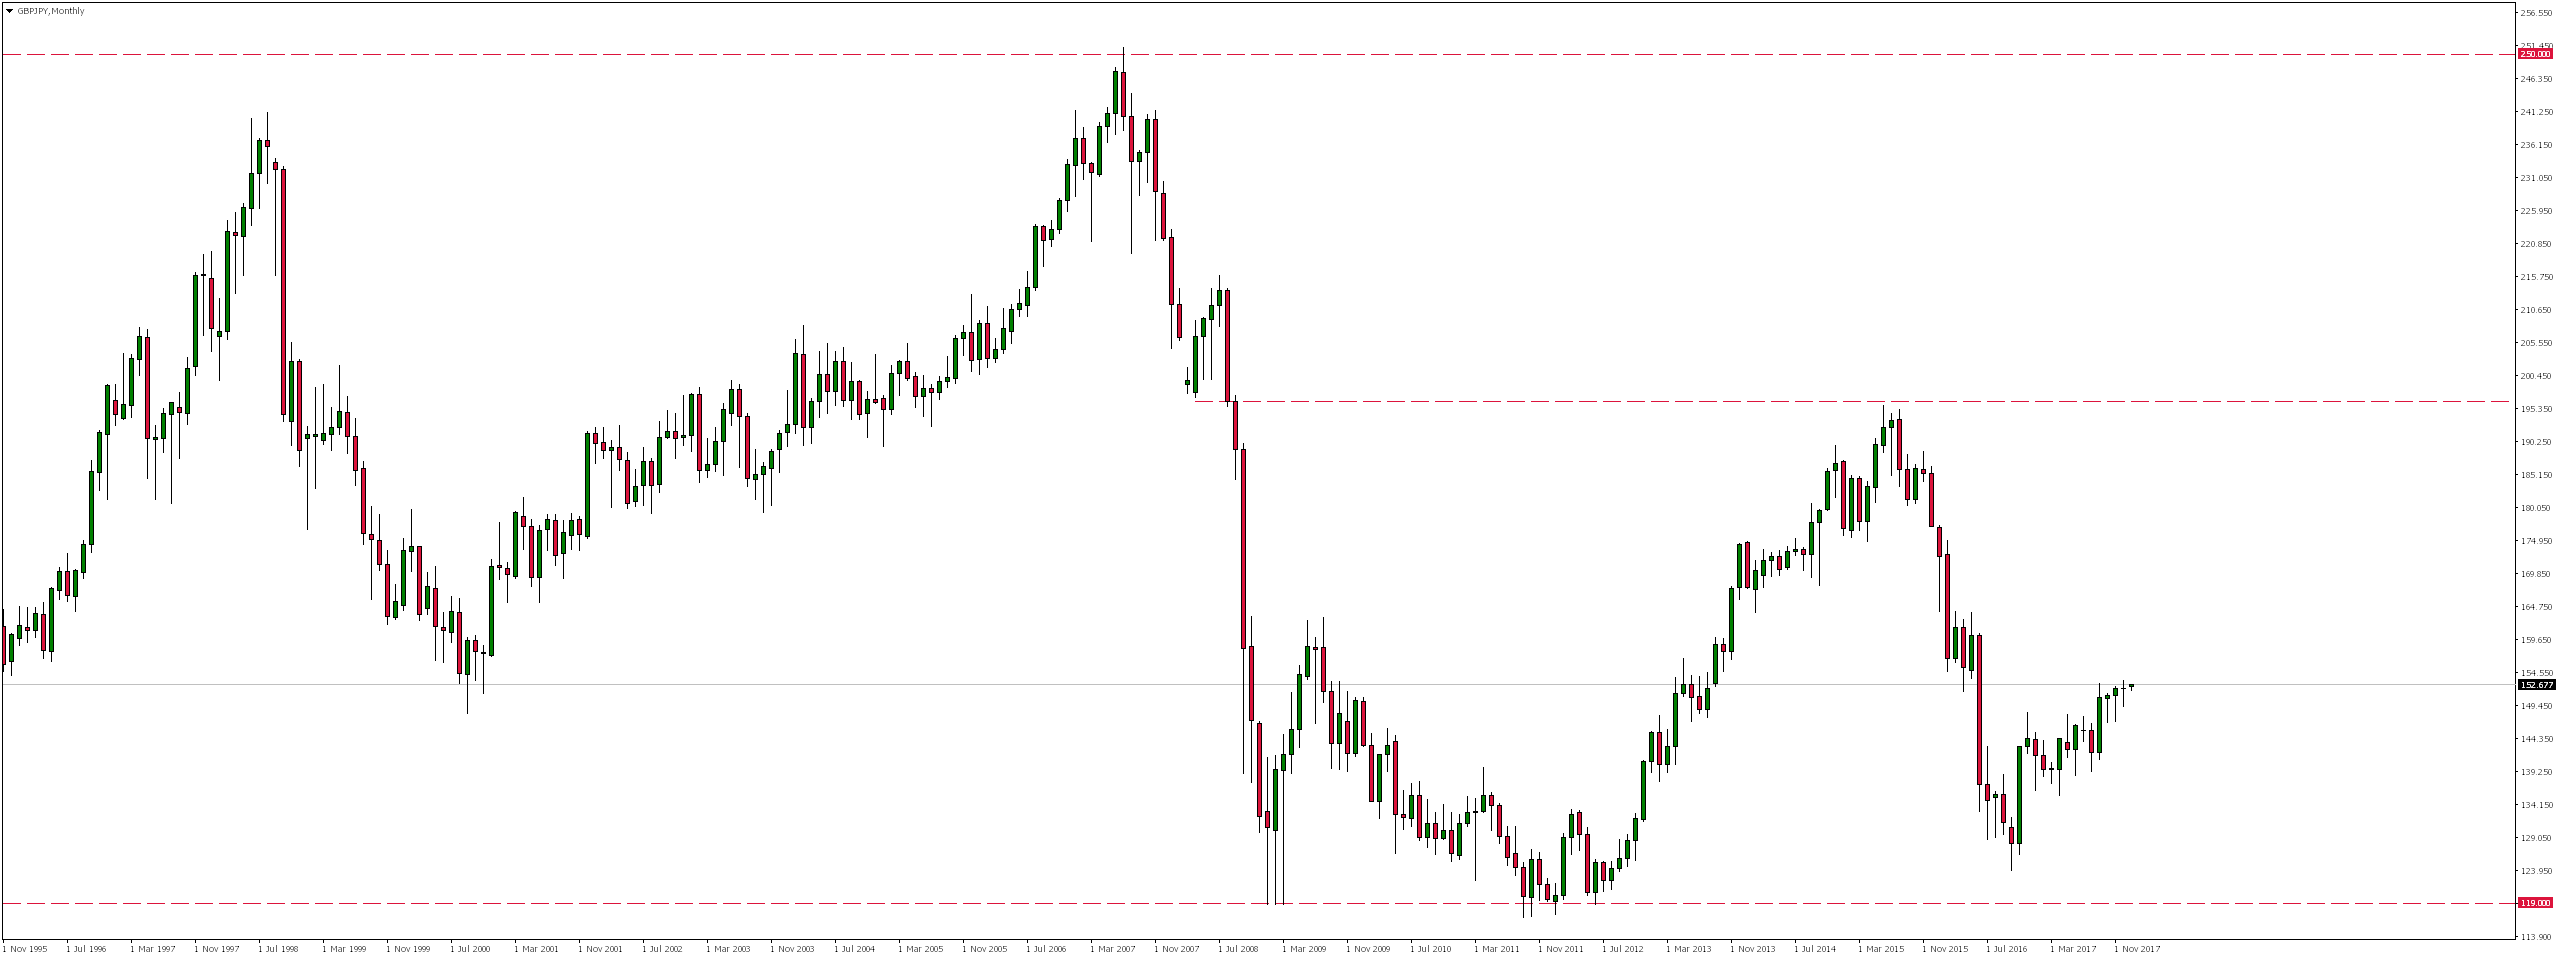
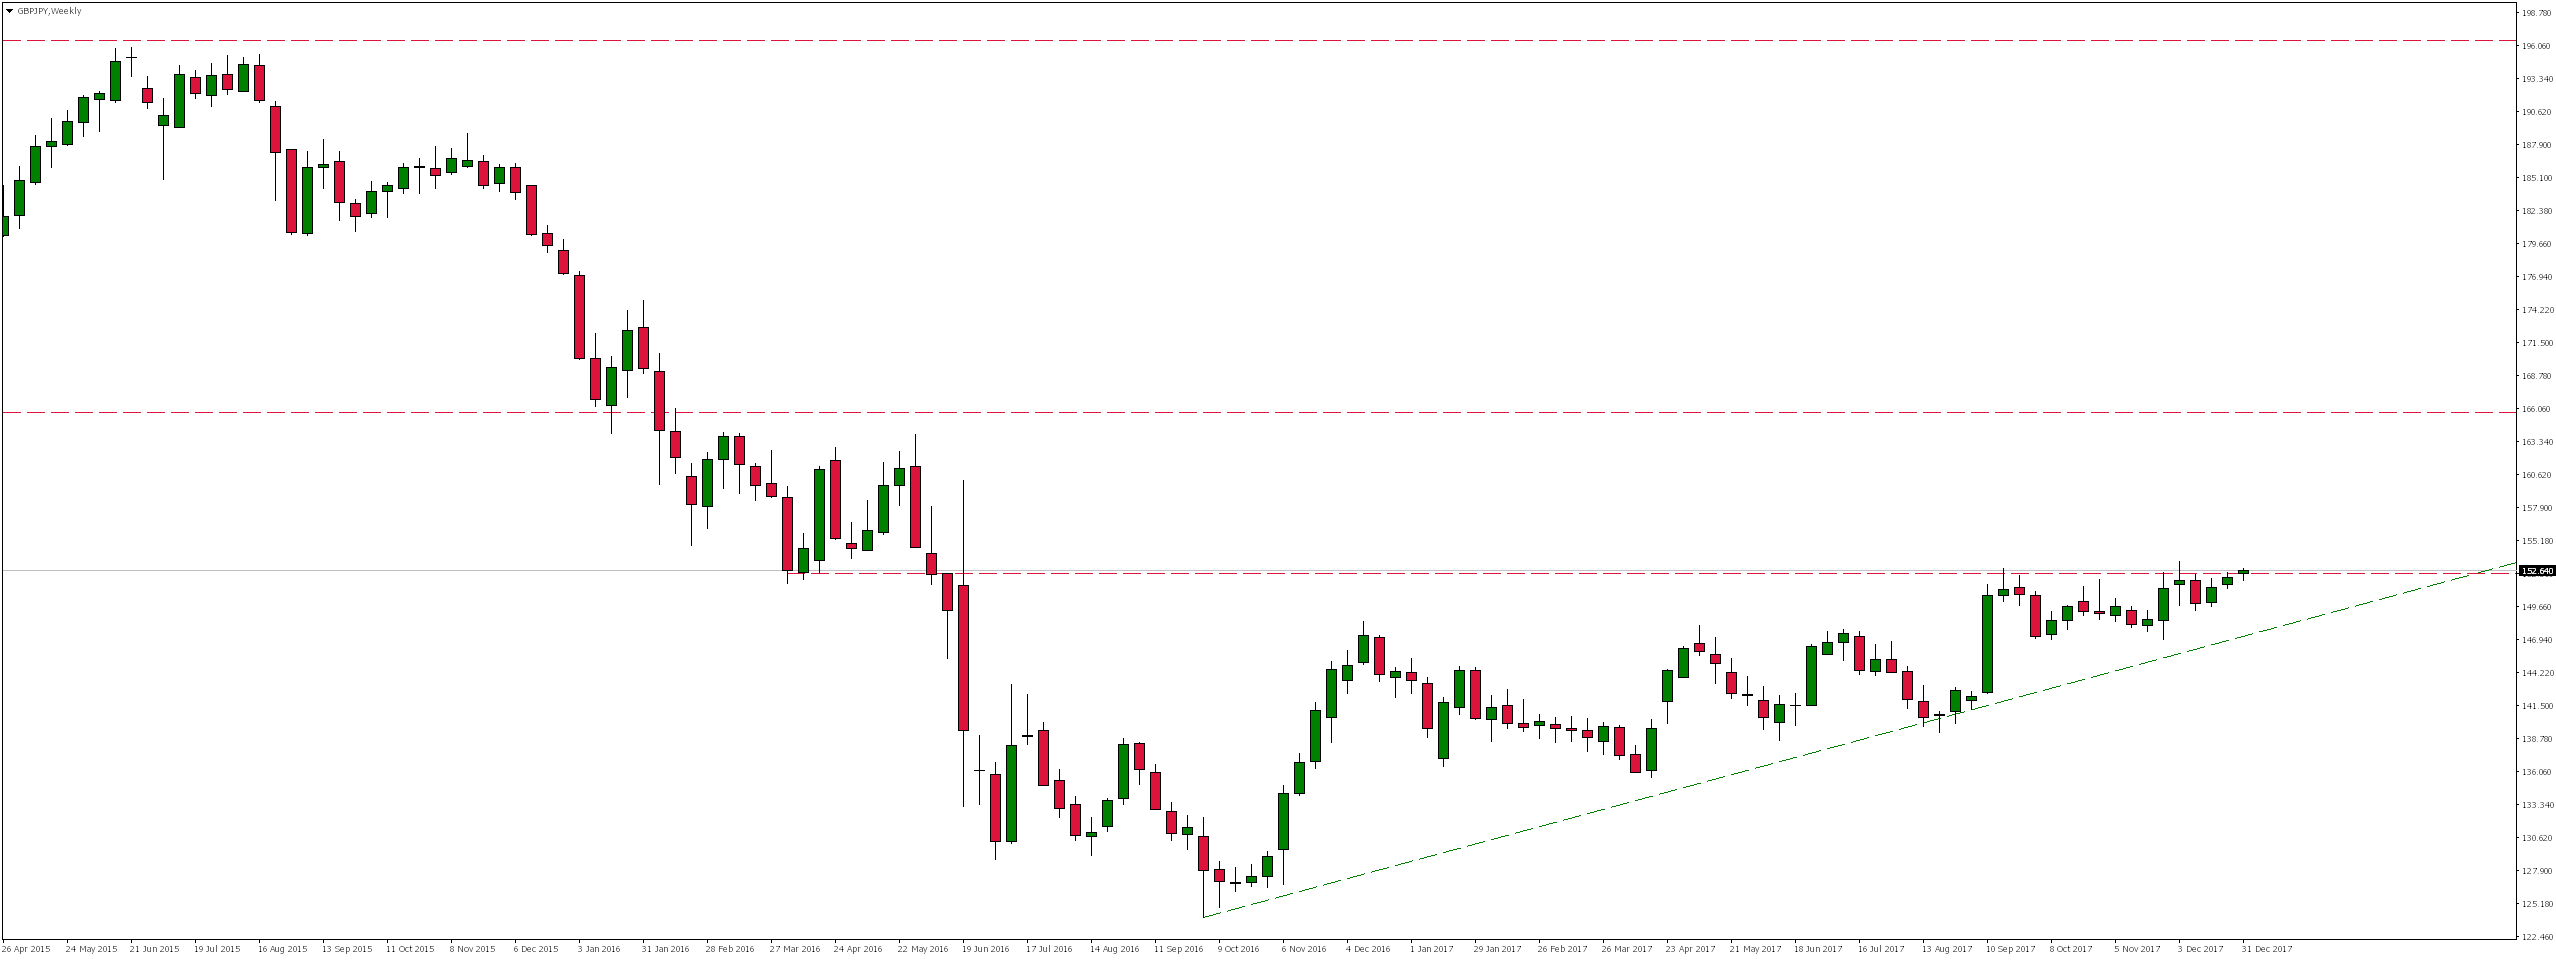
Due to the rejection of local resistance around the level of 195.00 GBPJPY, the currency pair from August 2015 was dynamically moving south. However, these declines did not reach the vicinity of previous lows and already in October 2016 a demand reaction appeared. Since then, we have been observing calm growth.
Looking at the weekly interval, we notice that as a result of these increases, the pair already in September last year reached 153.00, where it oscillates to the present day.
Permanent defeat of this zone could open the way for further increases even to the level of 165.00. However, taking into account the relatively small dynamics of this movement, it would seem that these increases are only a correction which may be followed by another downward impulse.
Error, group does not exist! Check your syntax! (ID: 4)
At the daily interval, we note that the pair from mid-September last year moves in consolidation, the lower limit of which coincides with 38.2% Fibonacci correction from the previous growth impulse.
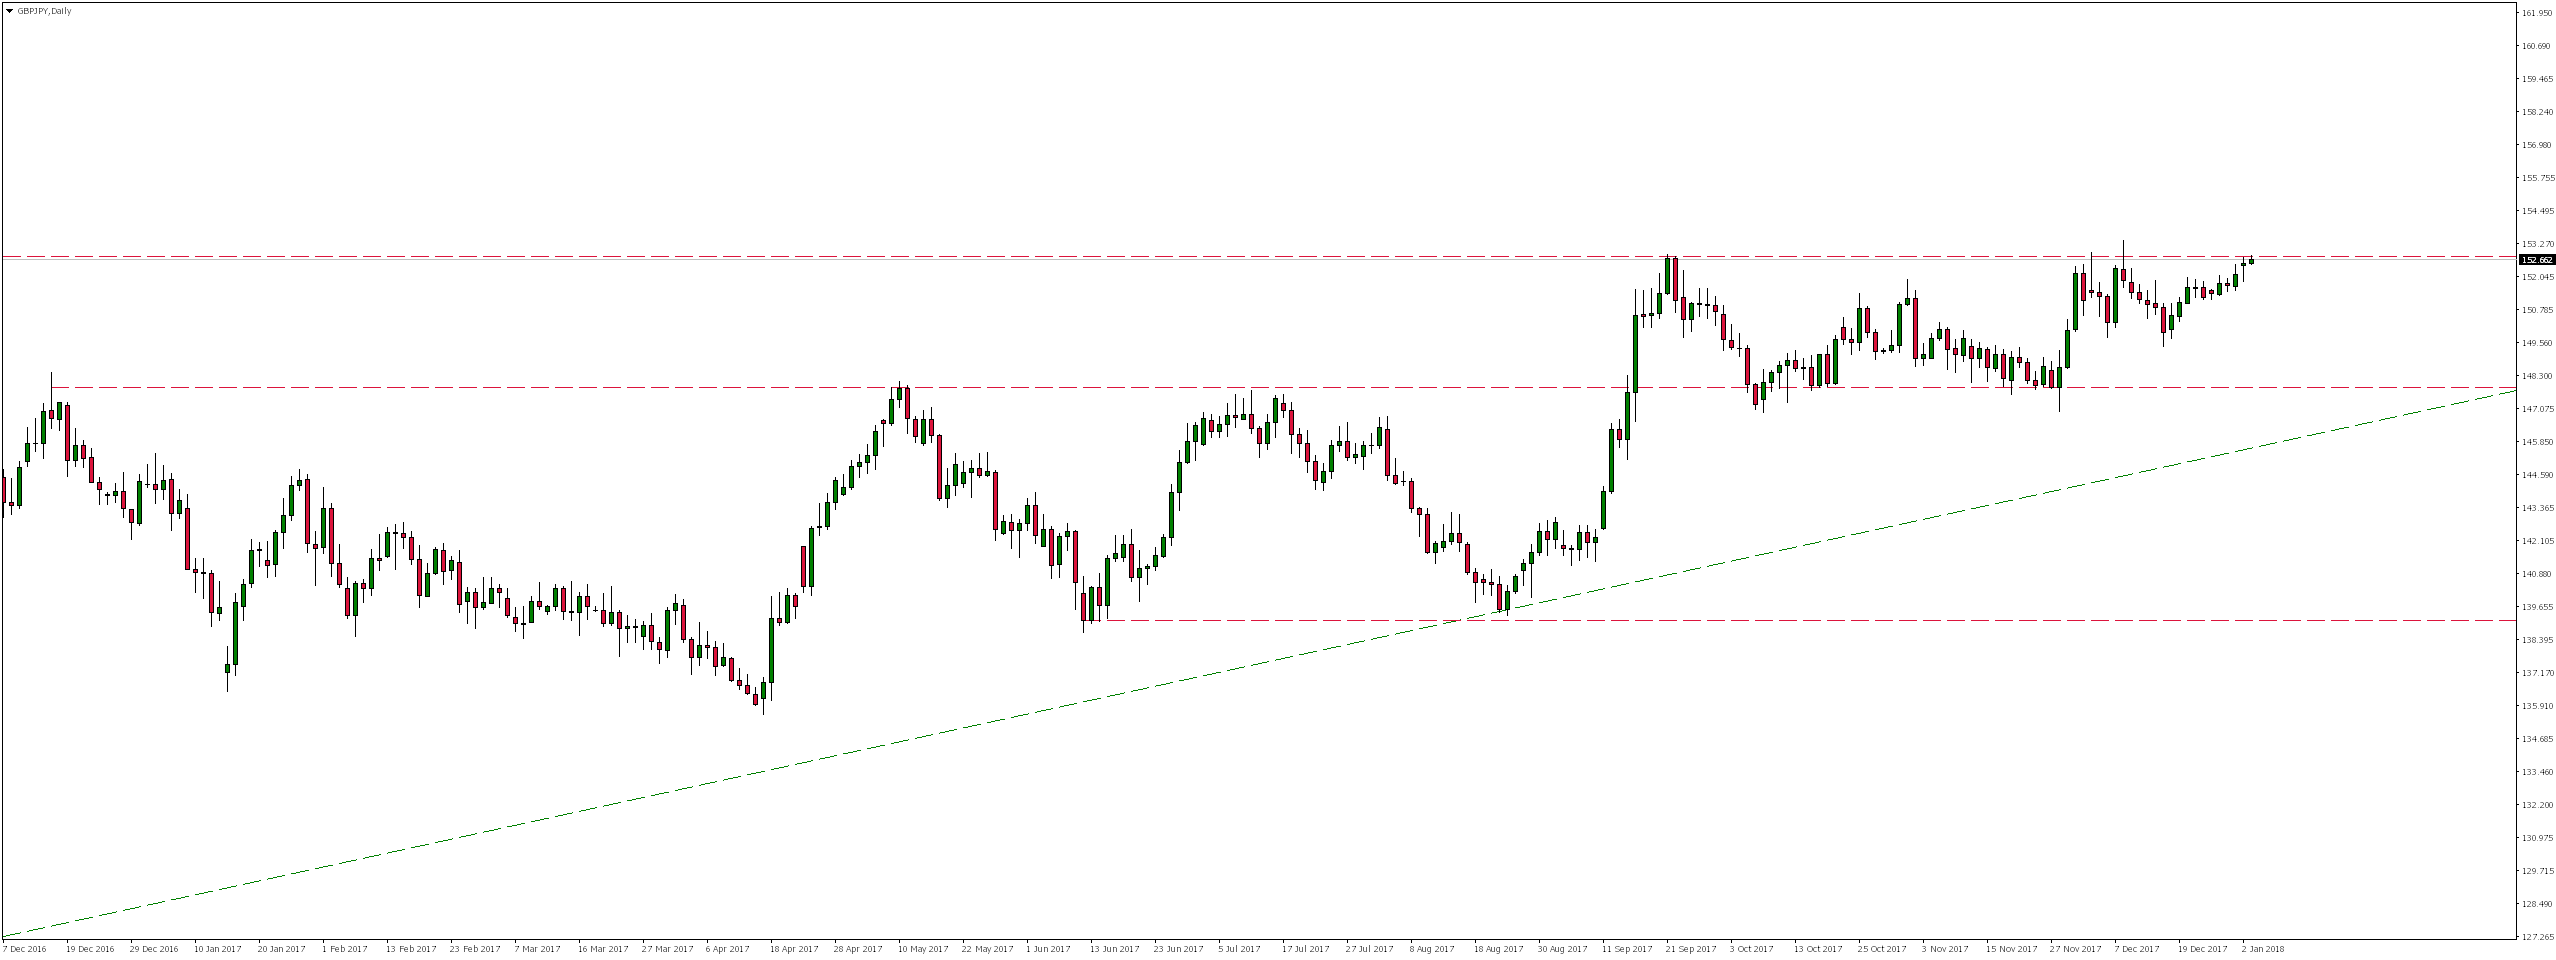
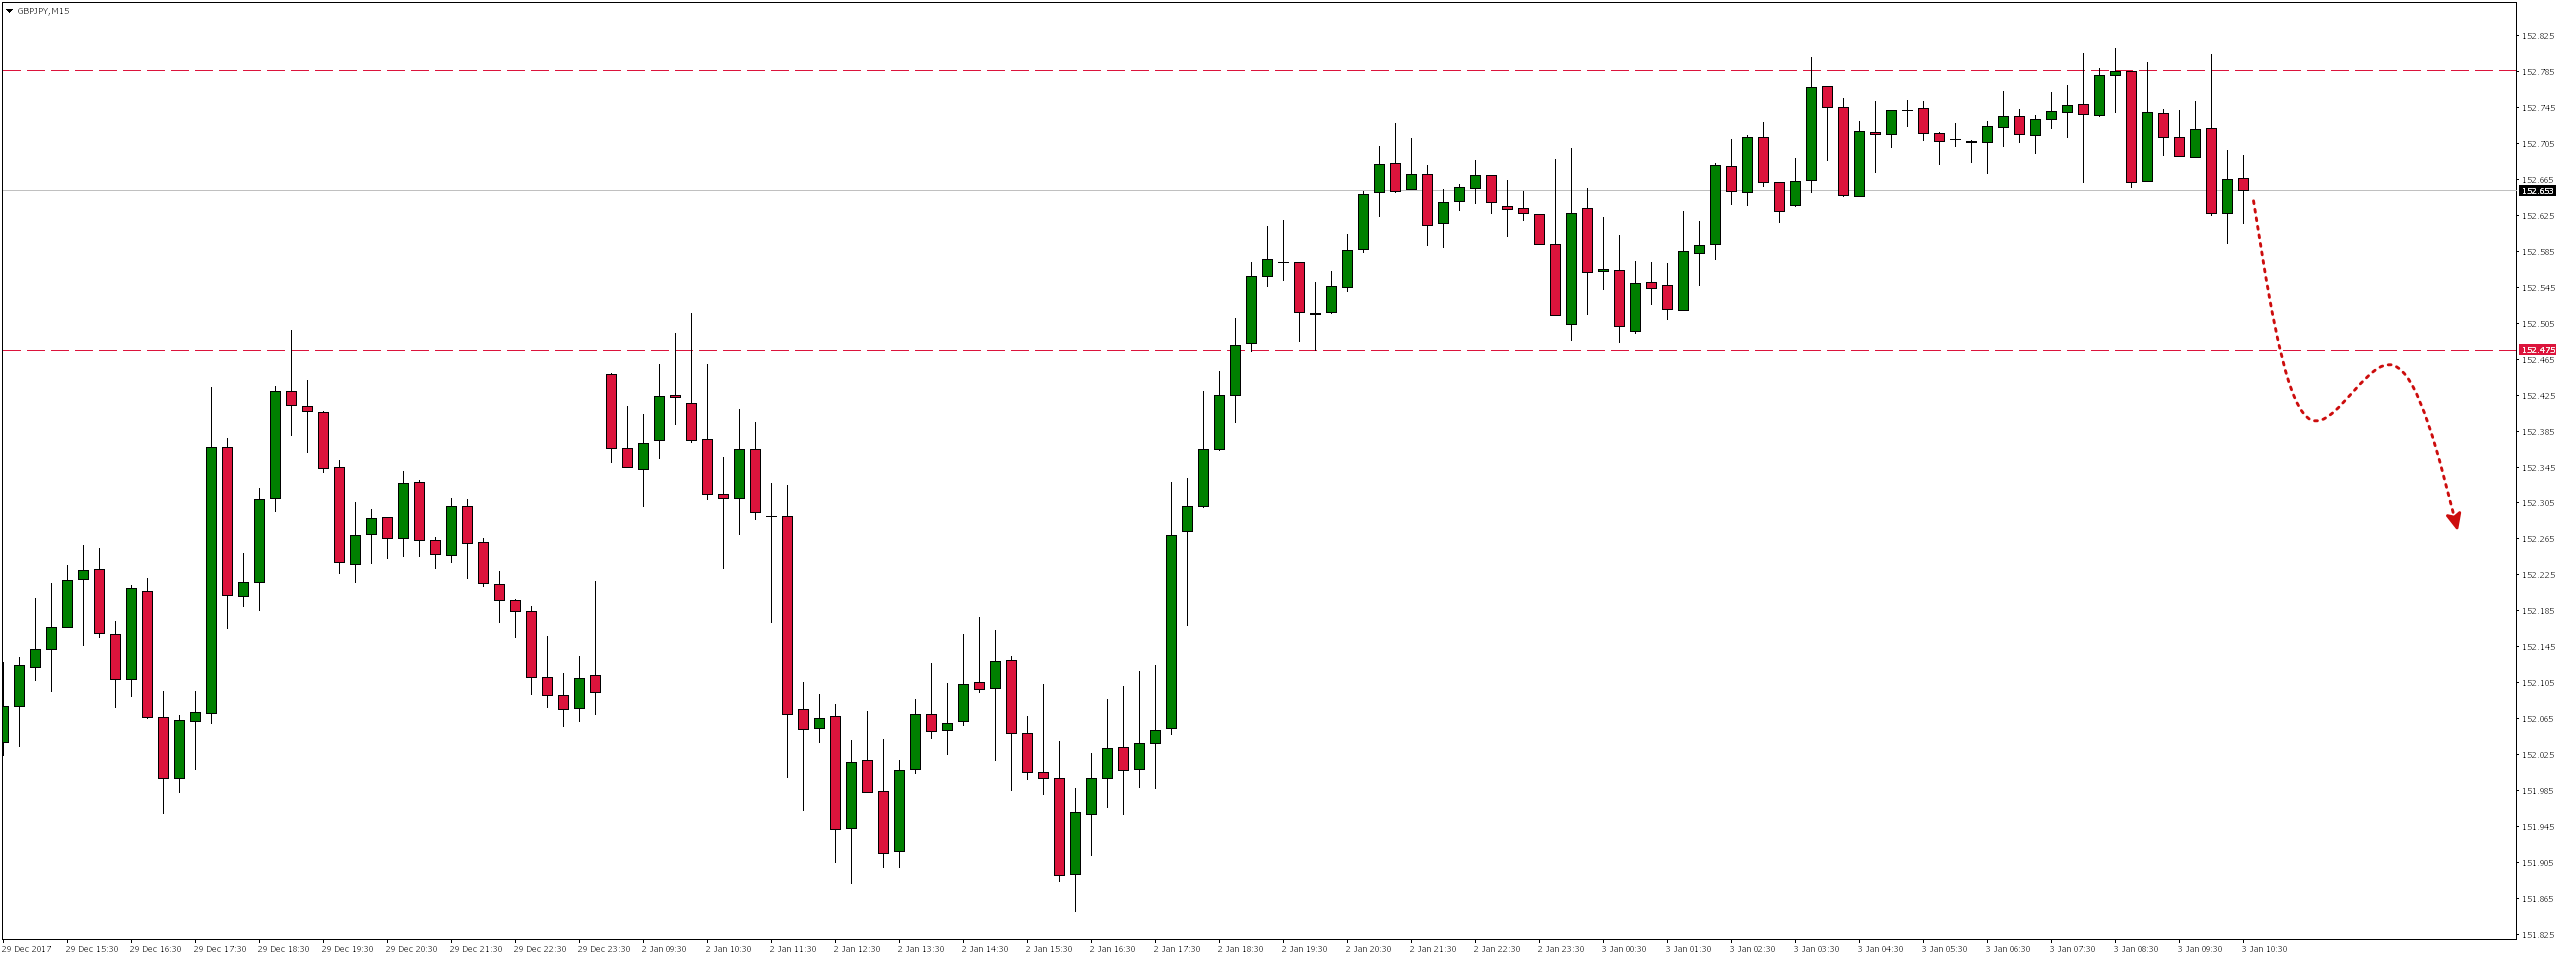
However, if the upper limit of this consolidation is once again rejected, we would expect a rebound. This scenario,supports today’s supply reaction rejecting currently tested resistance.
We would have to overcome local support in the area around 152.50 for the declines could be continued in a slightly wider time horizon. Only then would there be a bearish sequence of lower highs and lower lows.