![]()
![]() From Investor to Scalper – series of studies created in cooperation with broker BDSwiss, in which we take a financial instrument and the analysis includes a detailed look at the value from the monthly chart and ending with 5/15 minutes.
From Investor to Scalper – series of studies created in cooperation with broker BDSwiss, in which we take a financial instrument and the analysis includes a detailed look at the value from the monthly chart and ending with 5/15 minutes.
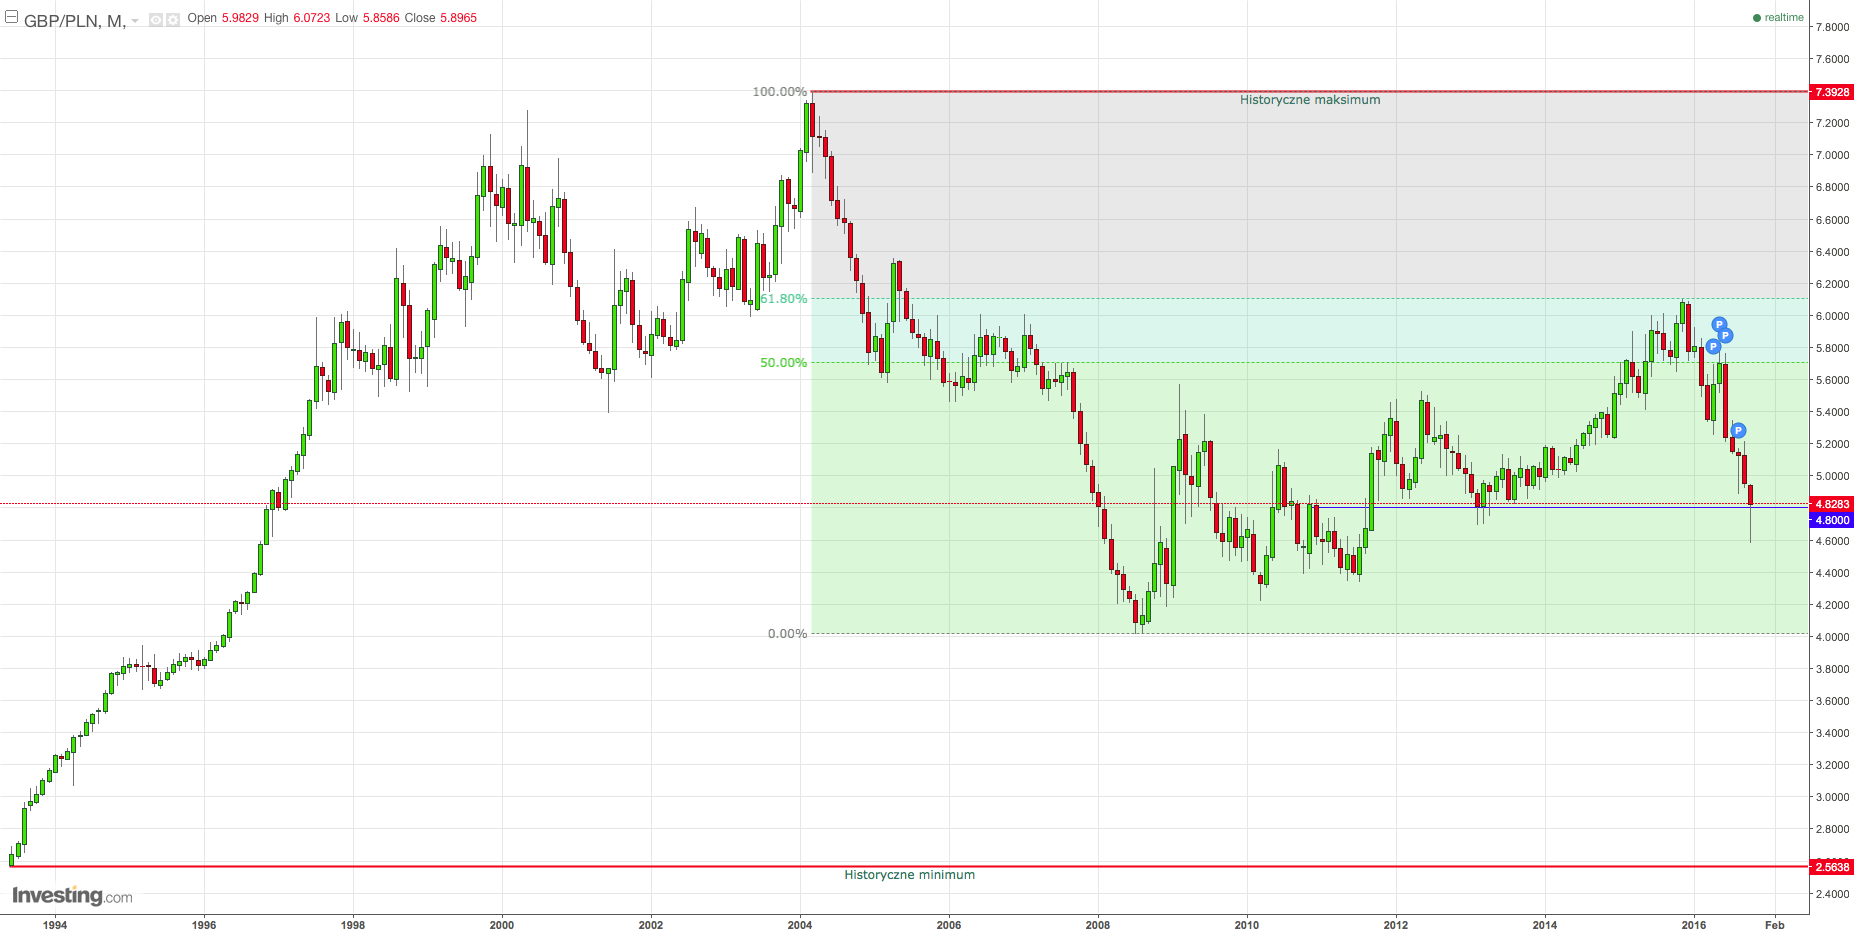
On the monthly chart we can see that since rejecting in December 2015 61.8% Fibonacci rejection of earlier decreases GBPPLN is moving down. Currently we are in are of very important support to 4.8000, breaking it could open way for further decreases even to 4.000 area.
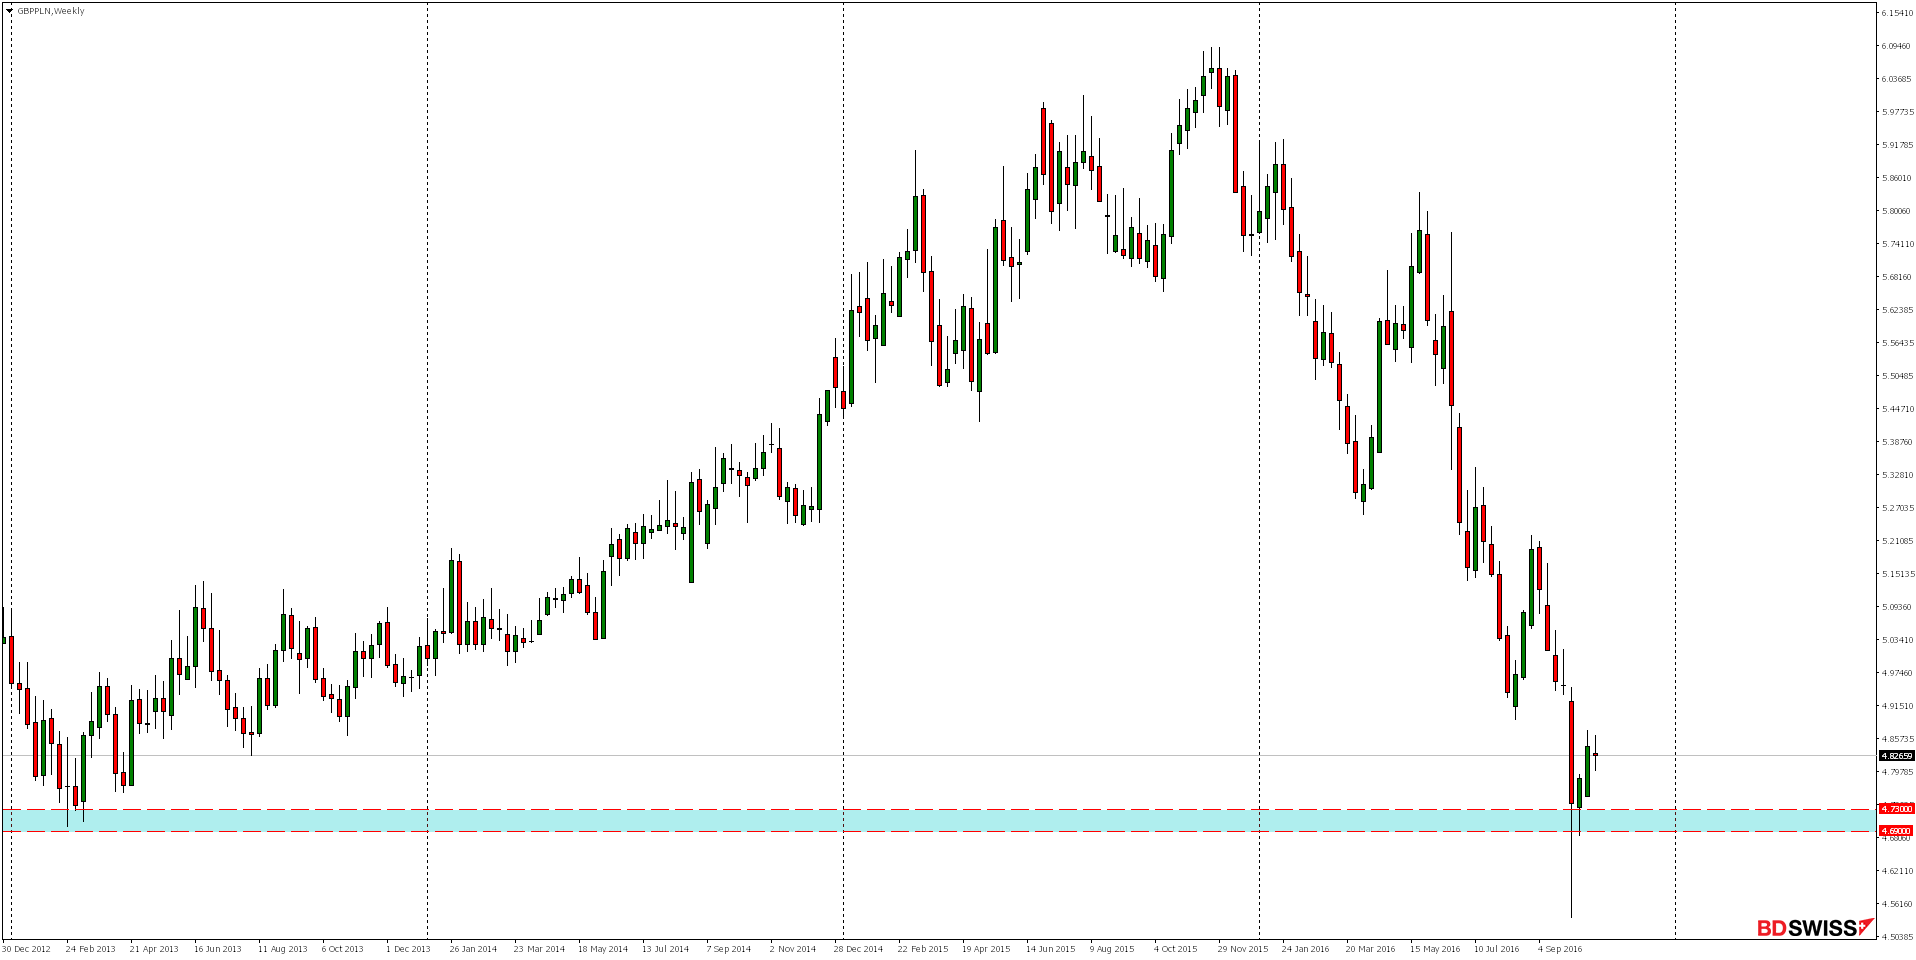
On the weekly chart we can see bullish reaction in support area and in closest time we can expect bullish correction.
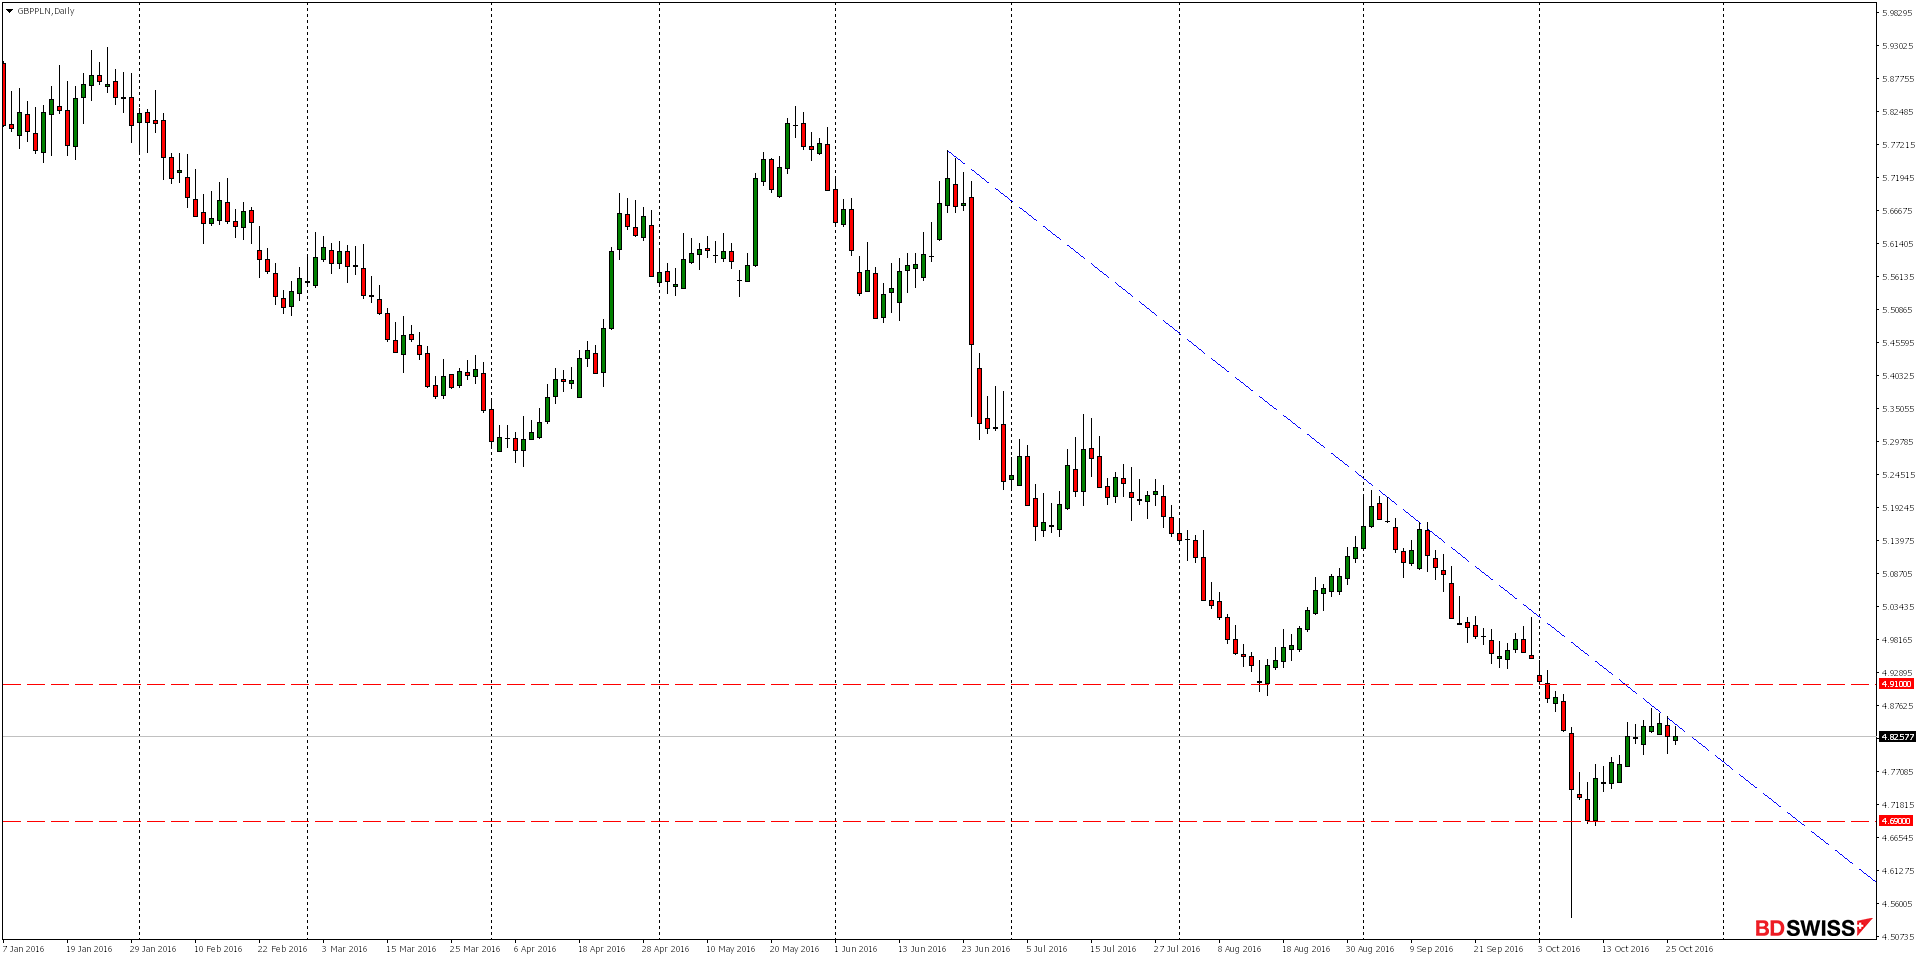
On the daily chart market did not reach 4.9100 resistance yet, now we can see gains slowing down and bearish reaction for the bearish trend line. Rejecting this level could stop further gains and could be a signal for continuation of bearish trend line.
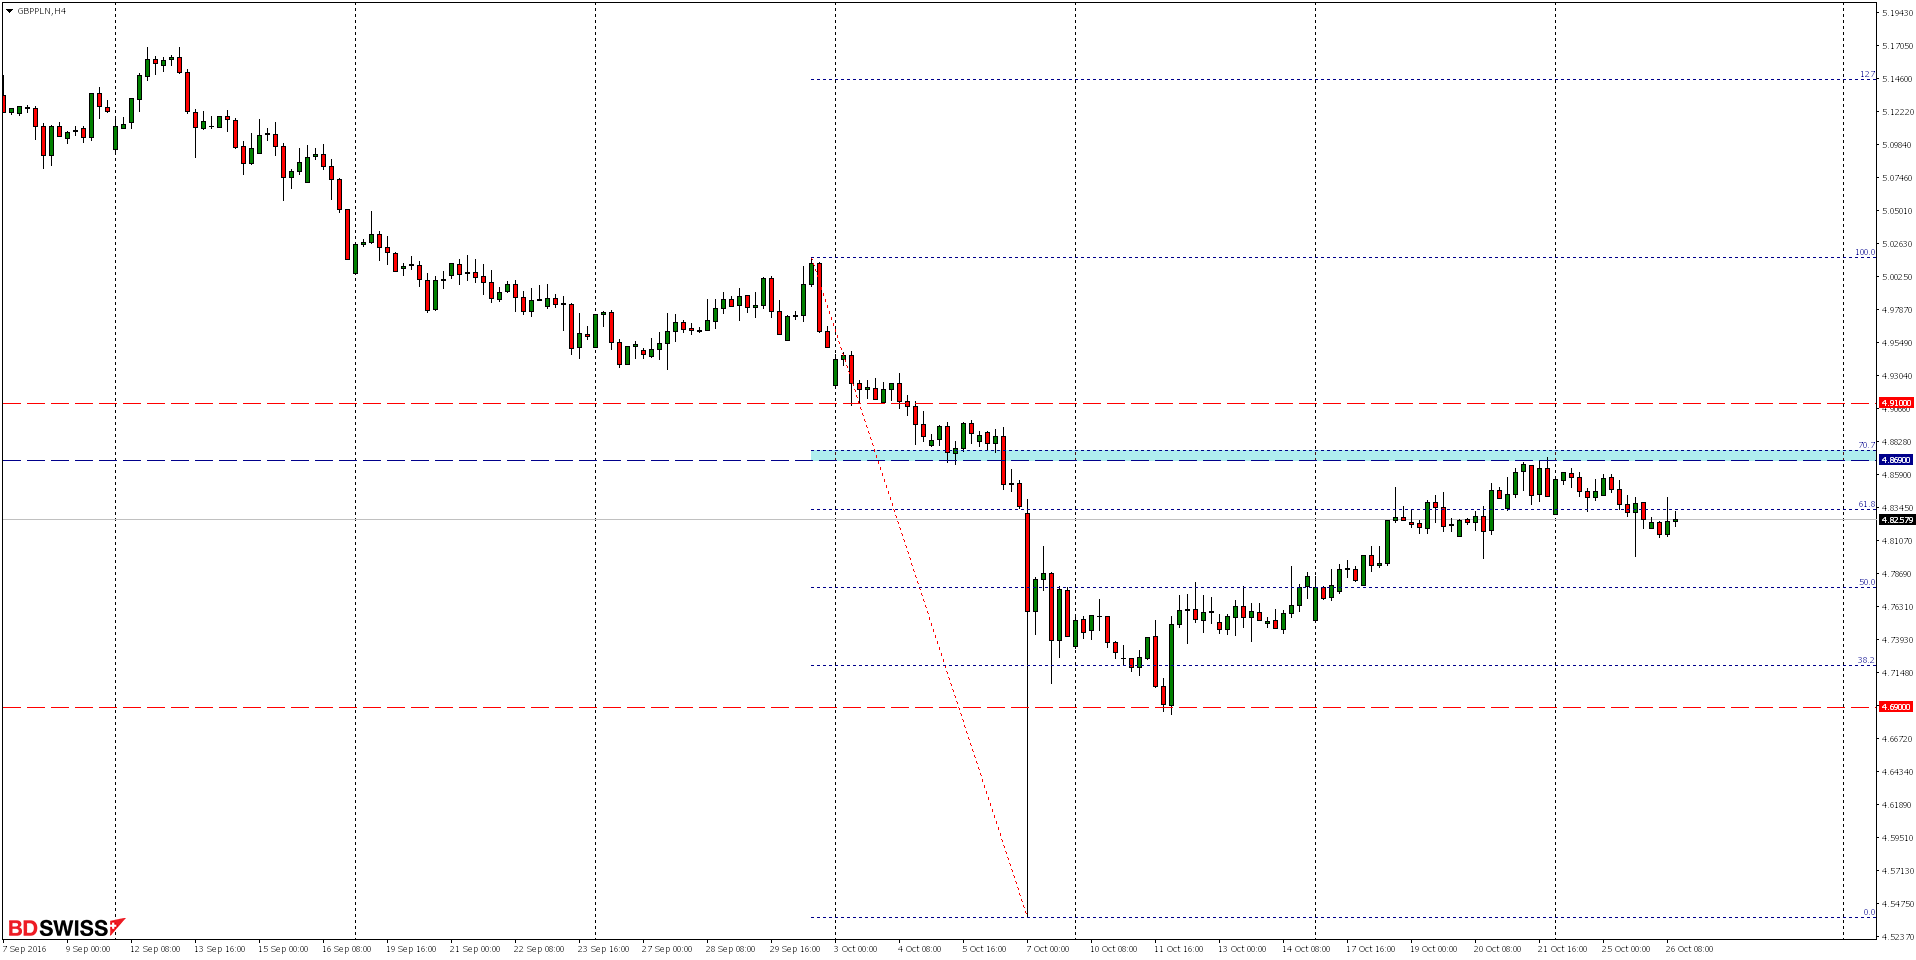
On the H4 chart we can see that decreases lasting since last week are a reaction of bears for mentioned downtrend line and local resistance area next to 4.8690 and 70.7% Fibonacci retracement.
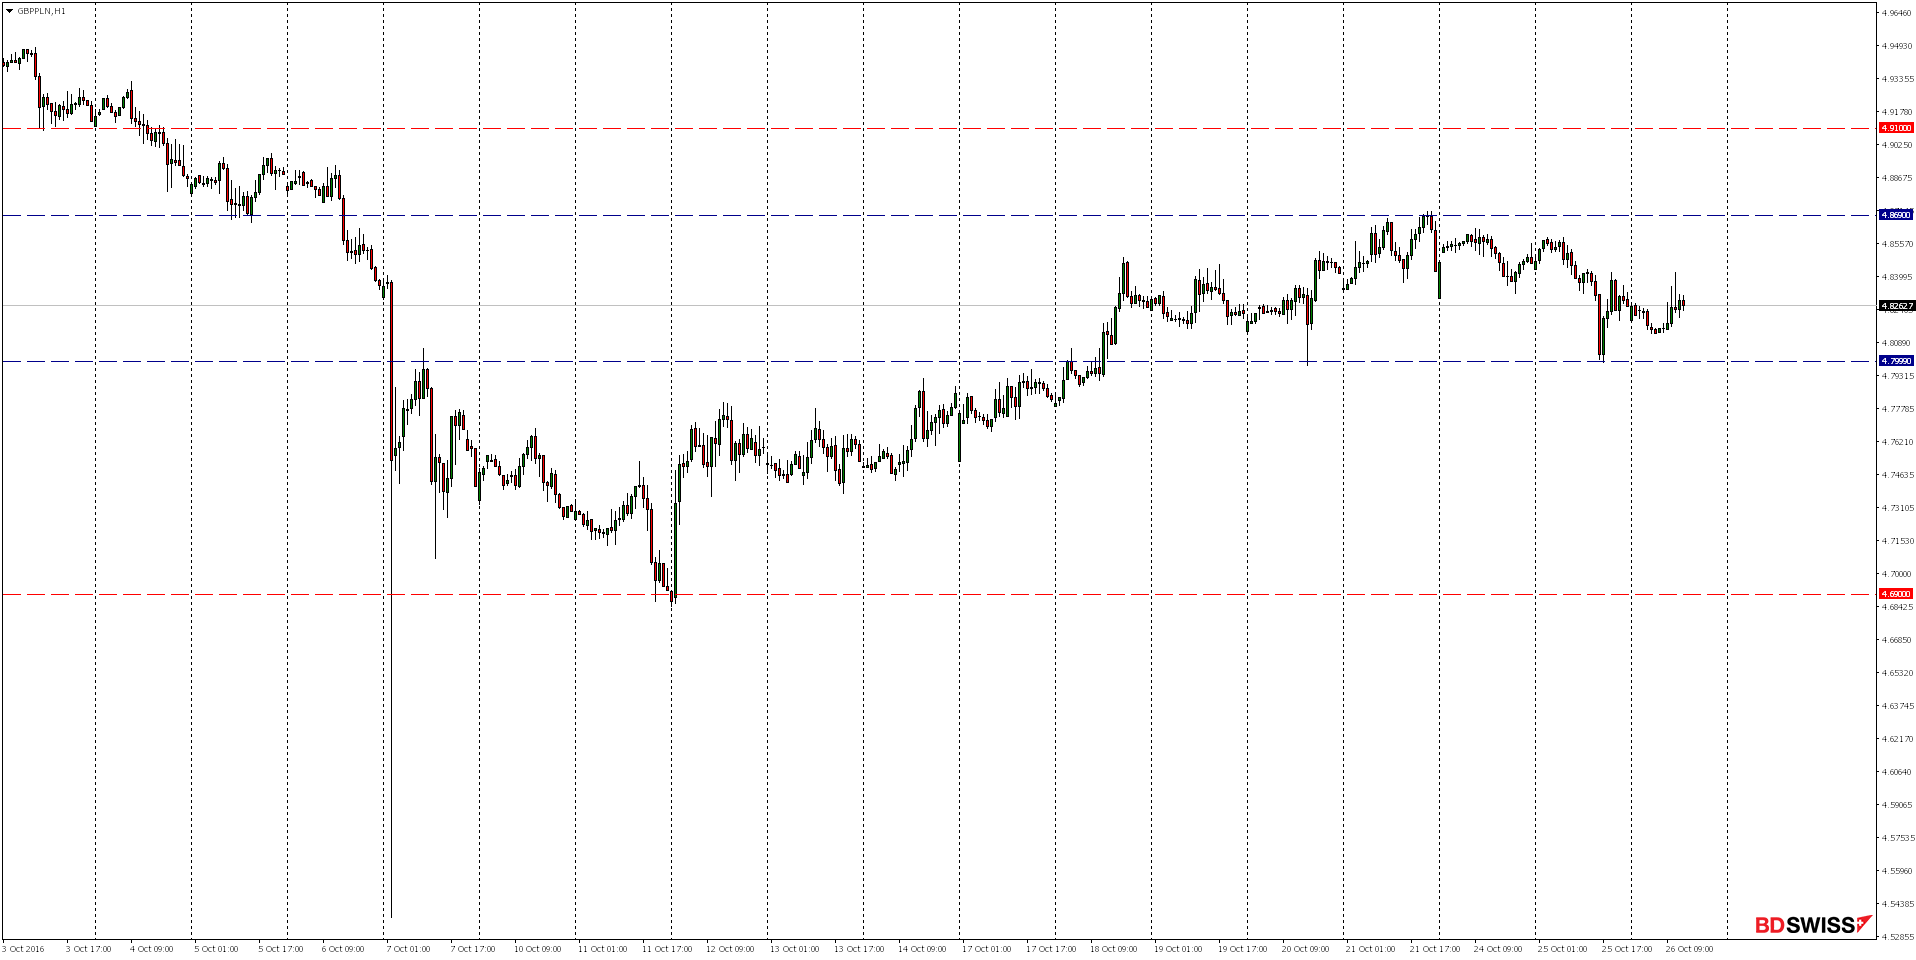
On the H1 chart for a week we can see consolidation. Considering dynamic gains lasting since October 12th and long upper wicks of last shadows it seems more probable that there will be break below, especially considering test of 4.9100 area.
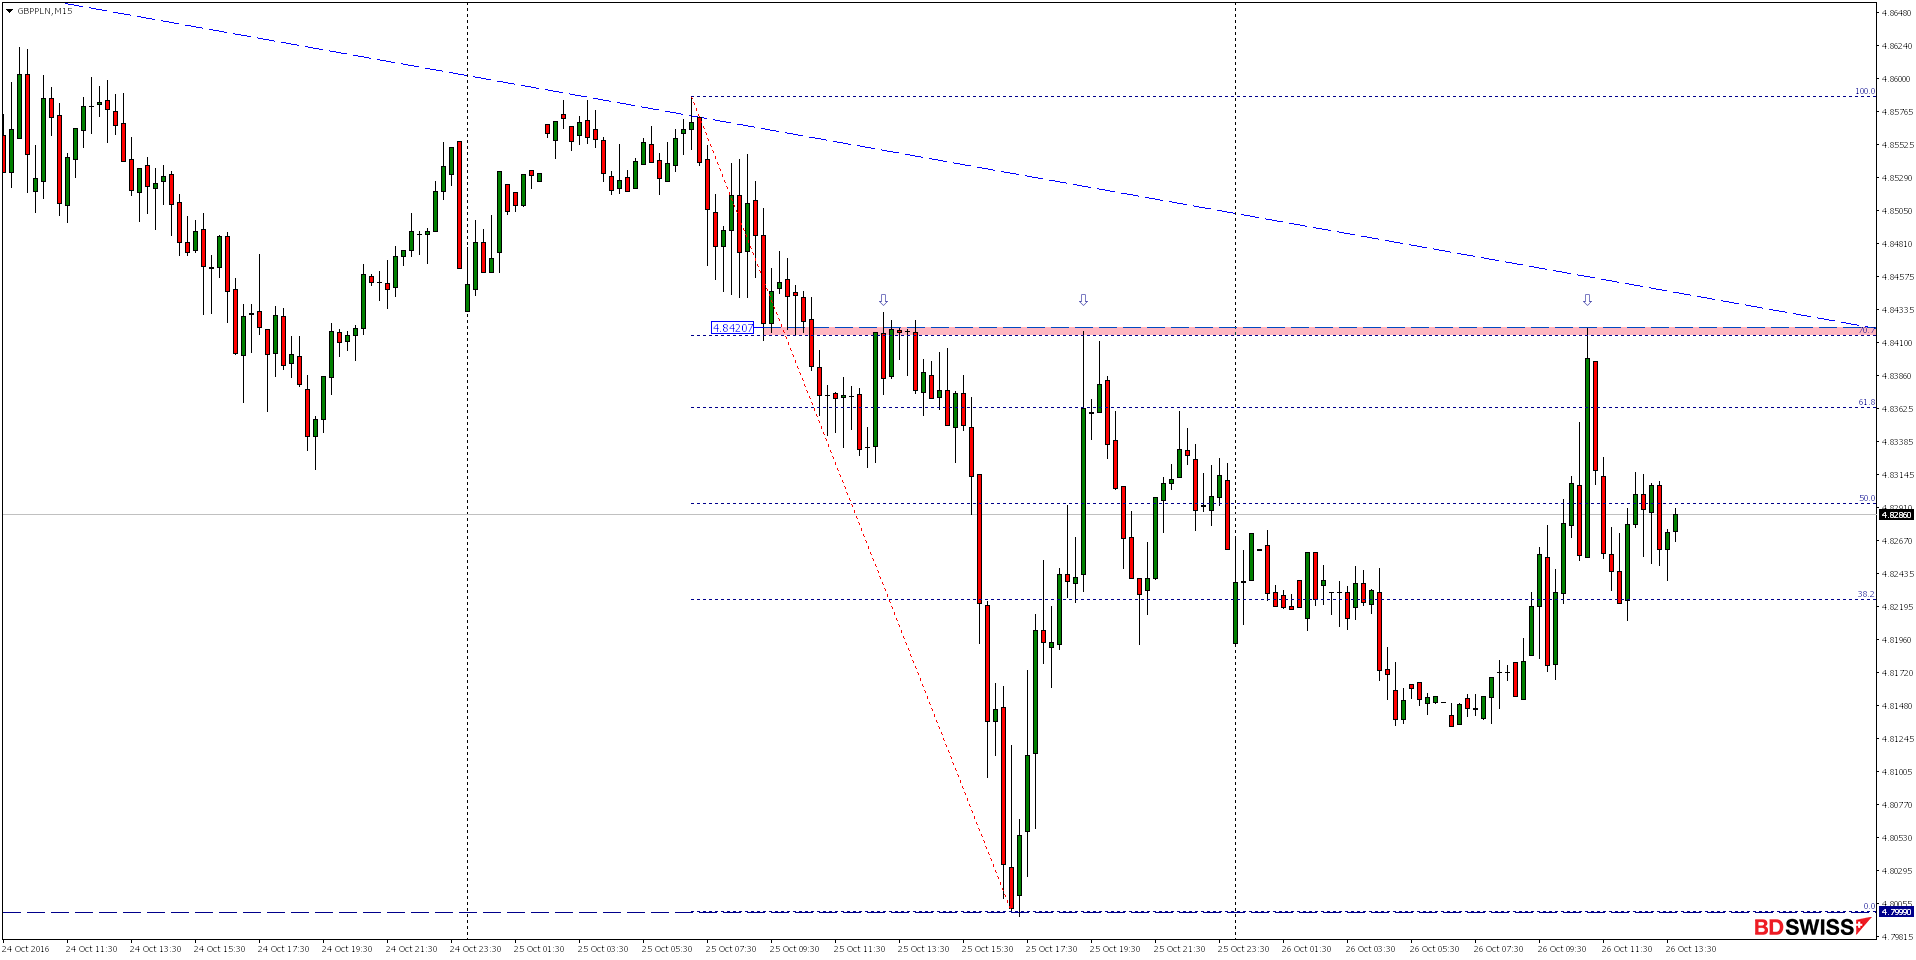
On the M15 chart we can see bearish reaction in local resistance zone between 4.8420 and 70.7% Fibonacci correction of last decreases. Considering that after breaking this level market re-tested it three times and there was always a rejection so we should expect continuation of decreases.