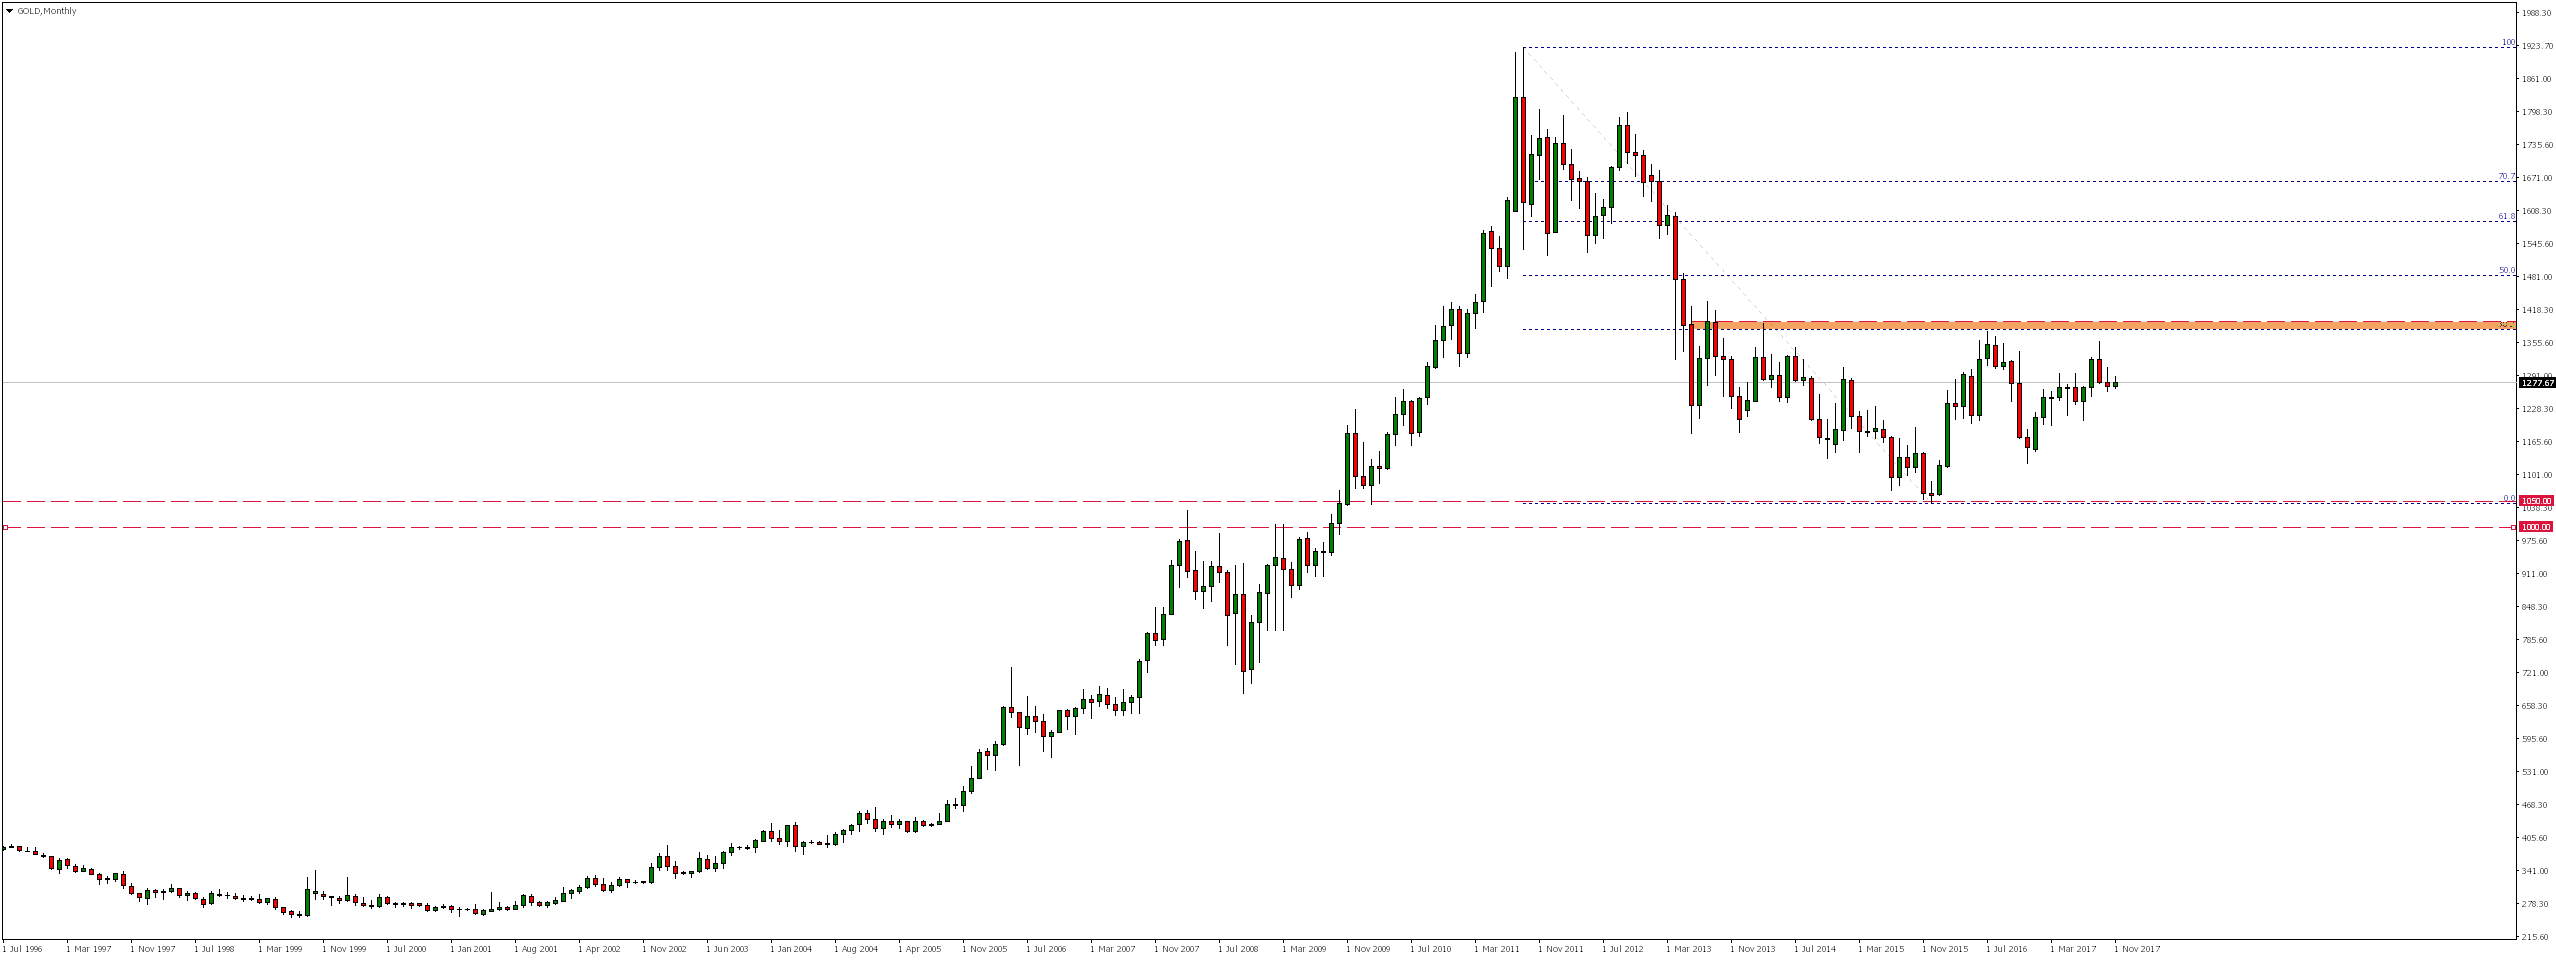
The GOLD market is not without a reason one of the safest investments because as you can see in the monthly chart from the very beginning of its quotes it moves calmly to the north. With the rise of demand for this material, the dynamics of growth accelerated, which finally set in September 2011 a historic maximum.
Since then we have seen declines as a result of which the market has reached in January last year level of 1050.00 from which reflected and then reached the vicinity of 38.2% of Fibonacci correction from these declines.
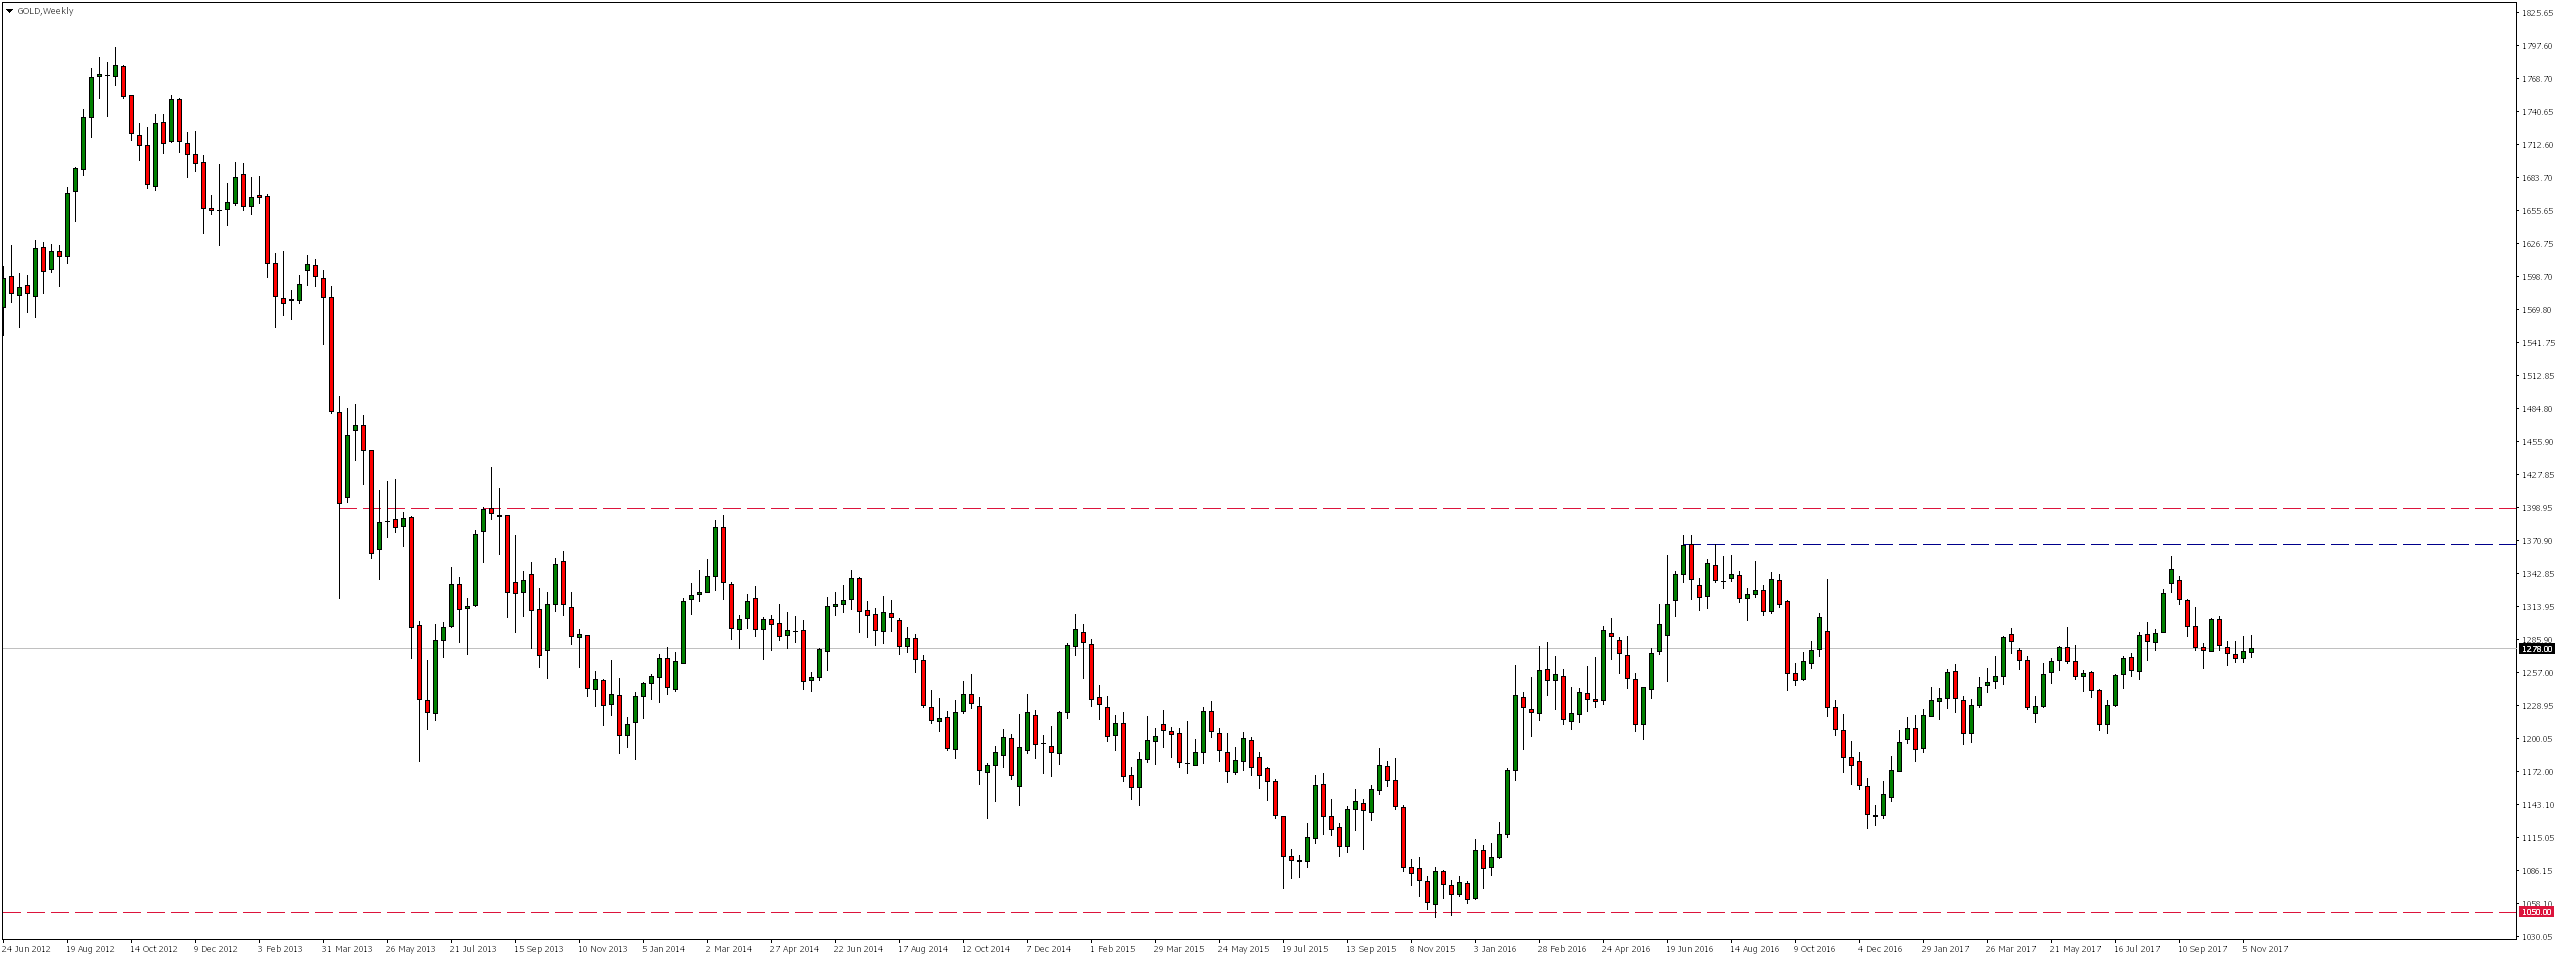
Looking at the weekly chart, we will note that the price from May 2013 is moving in a horizontal trend (in consolidation). Although recent increases have not reached the upper limit of this box, from mid-September this year again, we are seeing declines.
As a result of this decline, the market has reached and for some time oscillates around the upward trend line, which is also the lower limit of lasting from mid-December last year growth channel. Only breaking downward and defeating support in the area around $ 1267 could open the way to further declines. If that were to happen, we might even re-test the $ 1210 level.
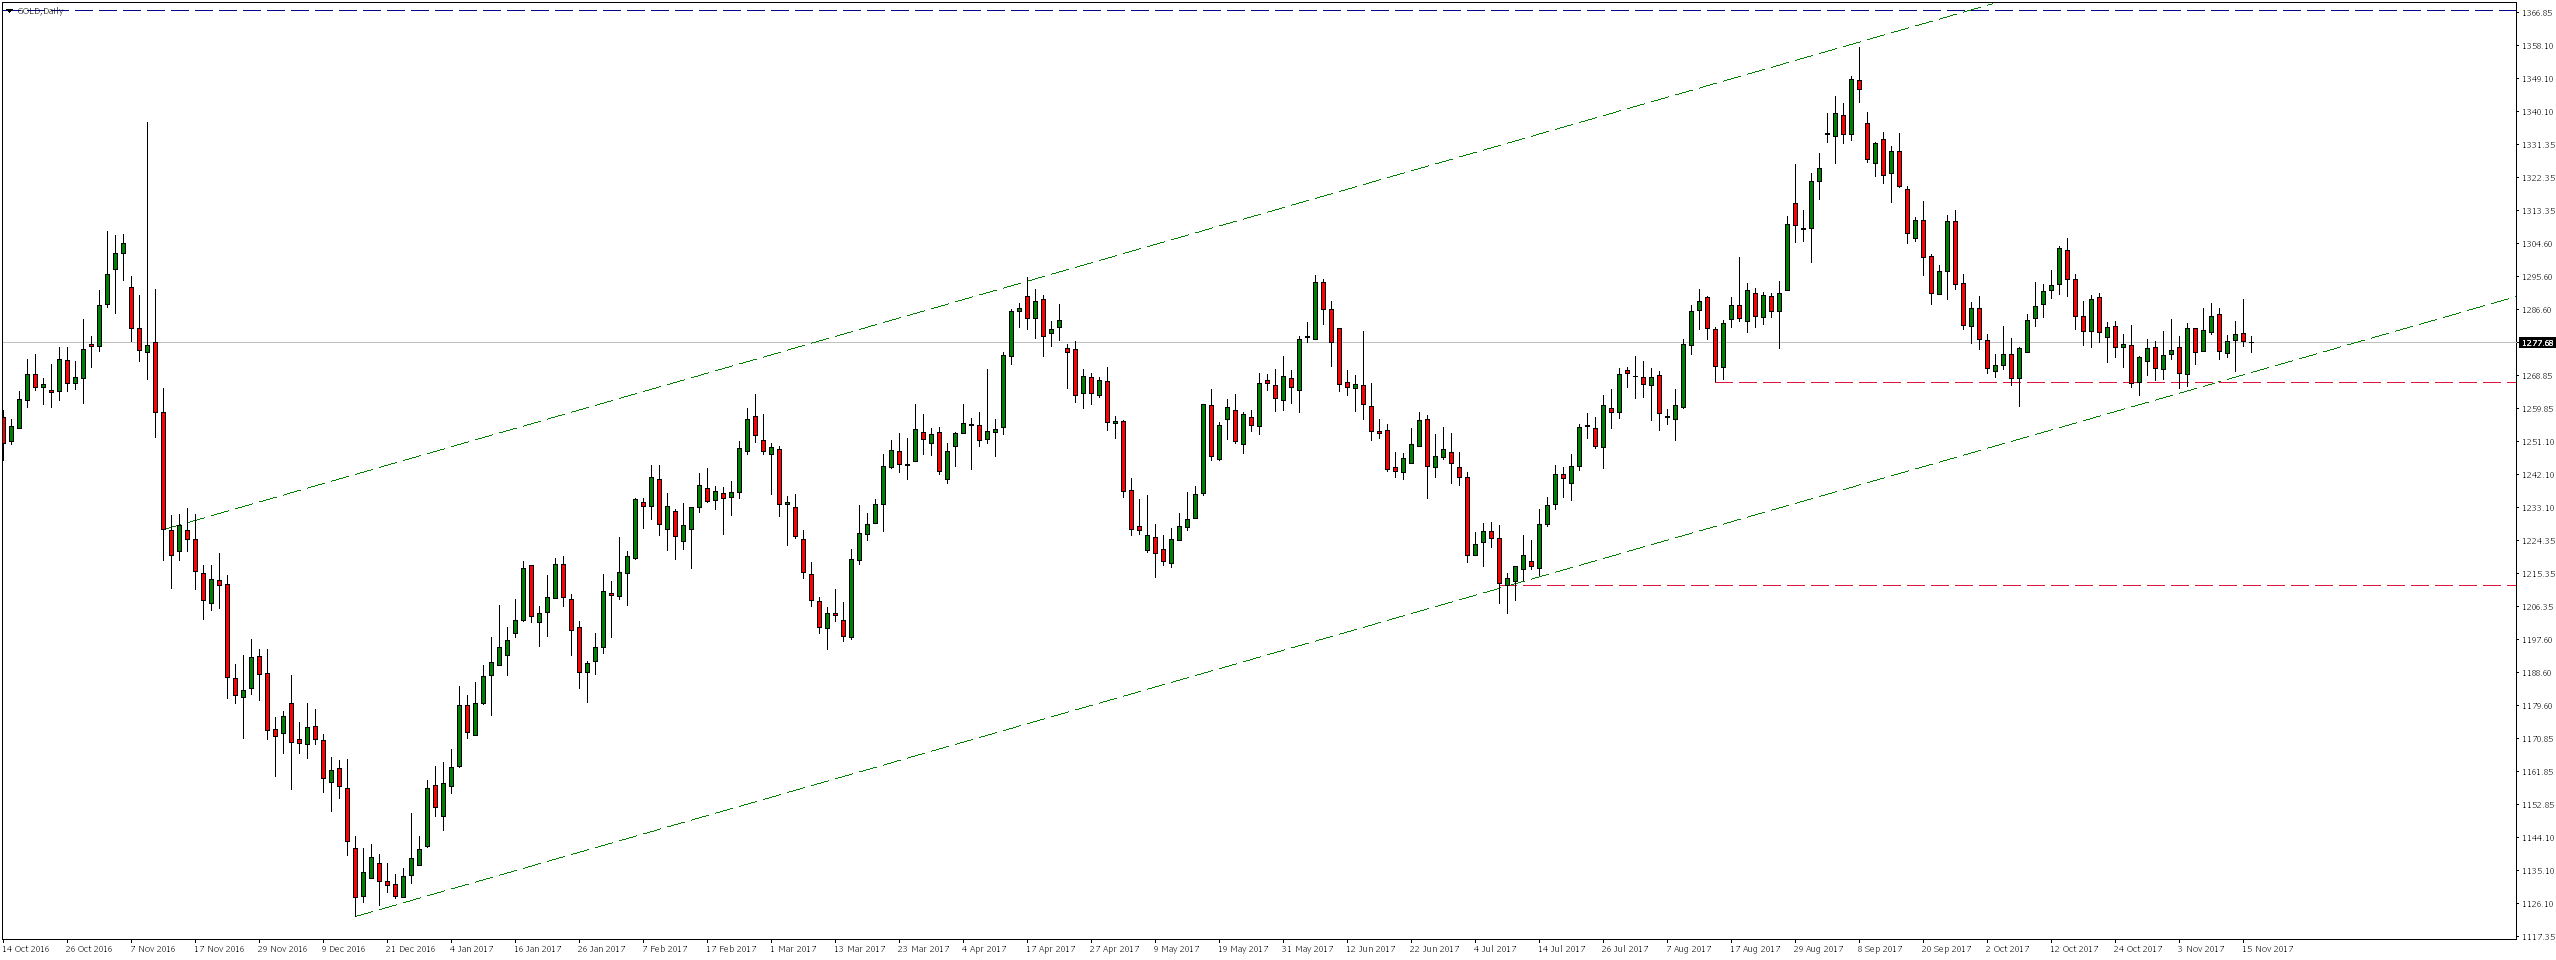
Looking at the H1 interval we notice that currently the technical situation is not very interesting. Since mid-October the course has been moving in a horizontal trend, and as long as we do not break out of this consolidation I would be cautious about opening any positions.
Given yesterday’s dynamic downturns, we expect to see them continuing and re-testing the upward trend line.

![]()
![]() STO is a broker regulated by FCA and CySEC. It offers more than 300 financial instruments such as Forex, Indices, Oil, Stocks, Commodities and Bonds. STO clients have possibility to trade thanks to reliable MT4 and AFX FAST platforms. Check STO offer!
STO is a broker regulated by FCA and CySEC. It offers more than 300 financial instruments such as Forex, Indices, Oil, Stocks, Commodities and Bonds. STO clients have possibility to trade thanks to reliable MT4 and AFX FAST platforms. Check STO offer!


