From investor to scalper is a series of analysis, where we take one financial instrument each day and the analysis includes a detailed look at the value from the monthly/weekly chart to the H1/M15.
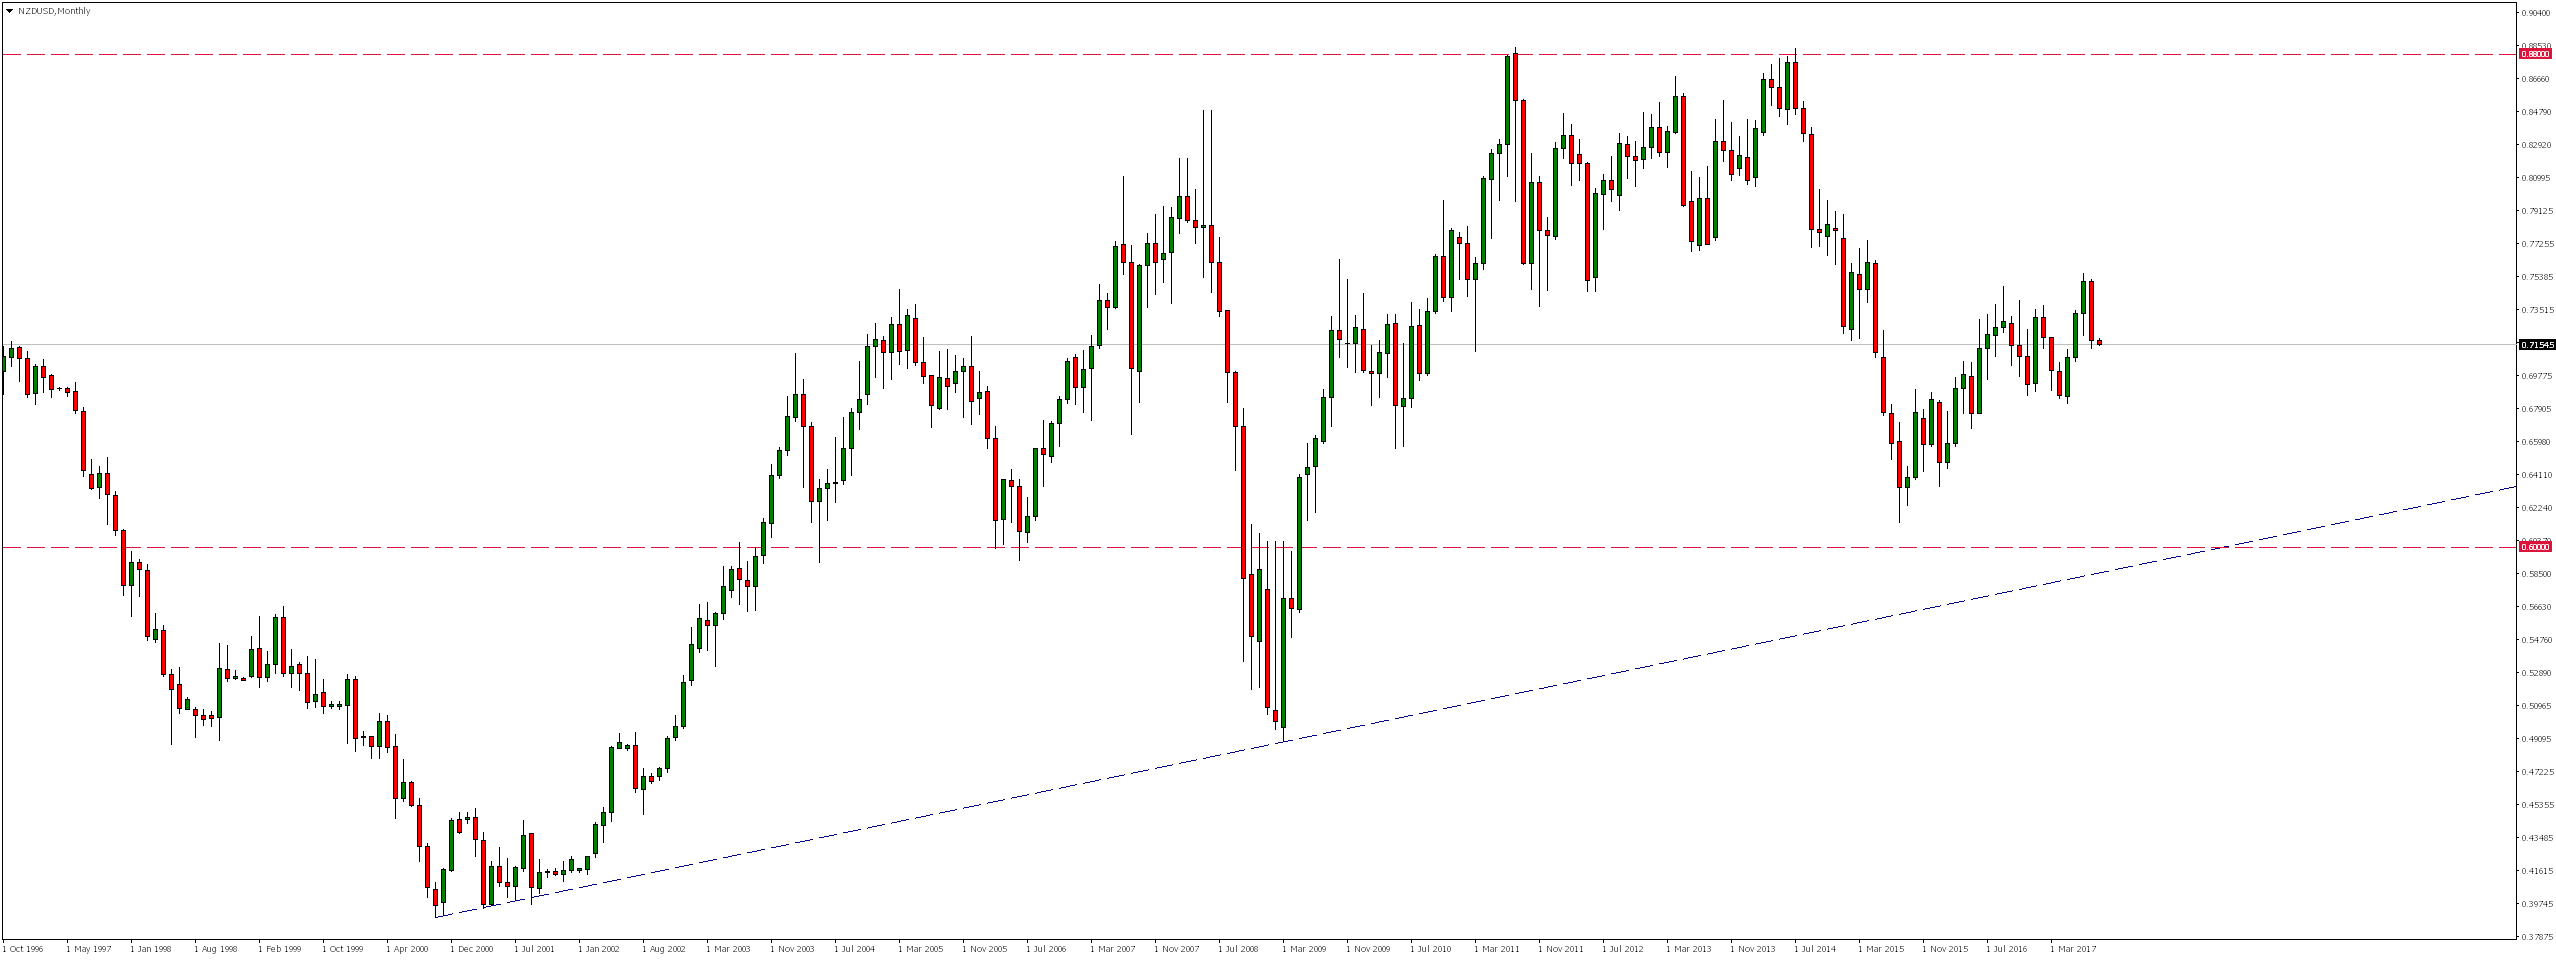
NZDUSD has moved south since setting formation of the double peak at 0.8800 in July 2014. Although these declines did not reach the 0.6000 level, a first reaction of bulls was in September 2015 and since then we have seen steady increases.
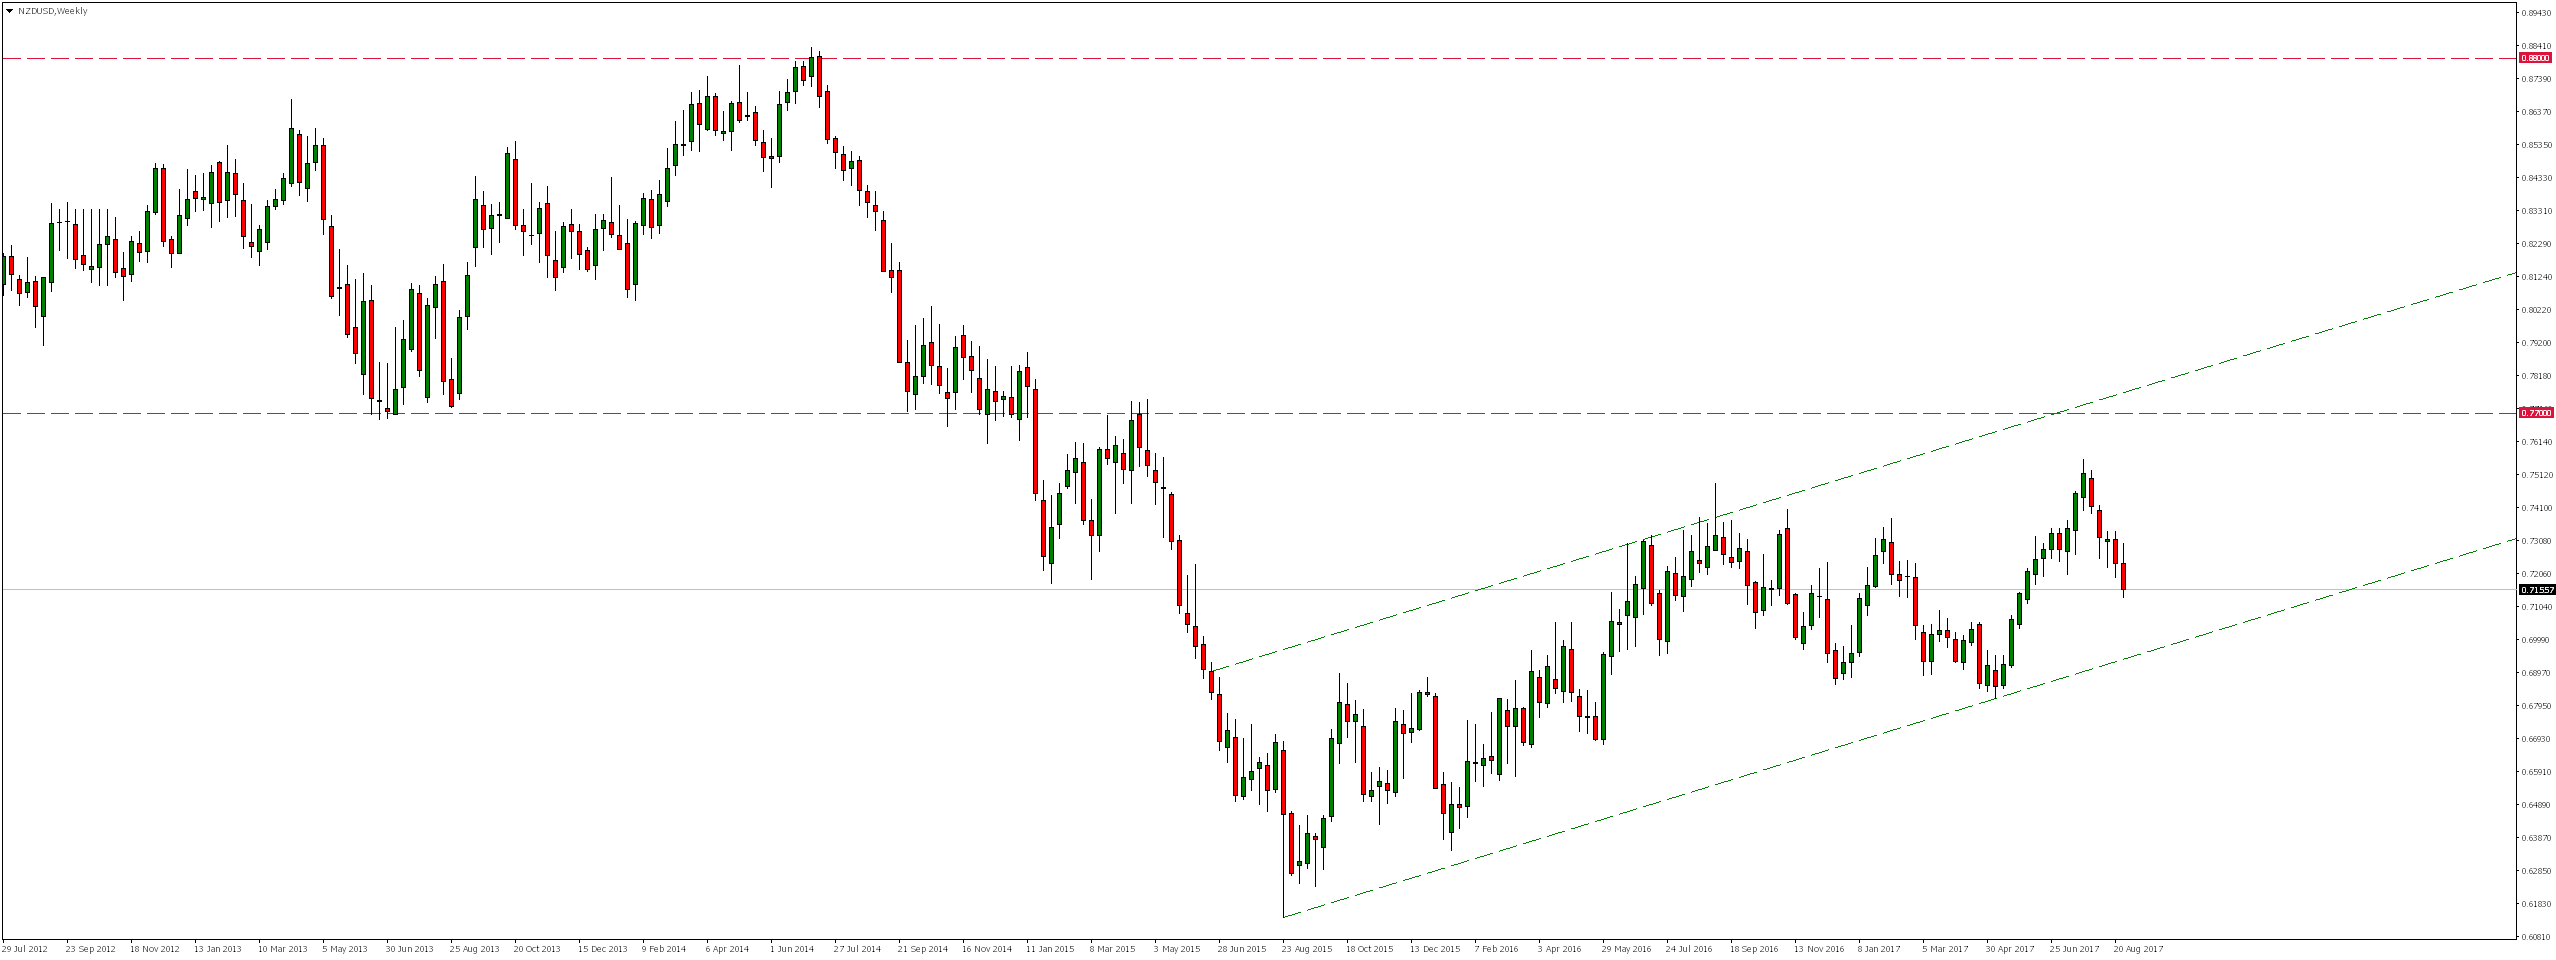
Looking on the weekly chart, we find that all these increases are within a channel. Although the market has not reached either its upper or lower limit (resistance) around 0.7700, we have seen declines for last five weeks.
On the daily chart, we notice that as a result of these falls a bearish head and shoulders formation has been created, and the market broke yesterday neckline, opening way to further declines. Although technical range of this formation coincides with support at 0.6840 level, the first demand response could be expected sooner, already around 0.7050 level.
Error, group does not exist! Check your syntax! (ID: 4)
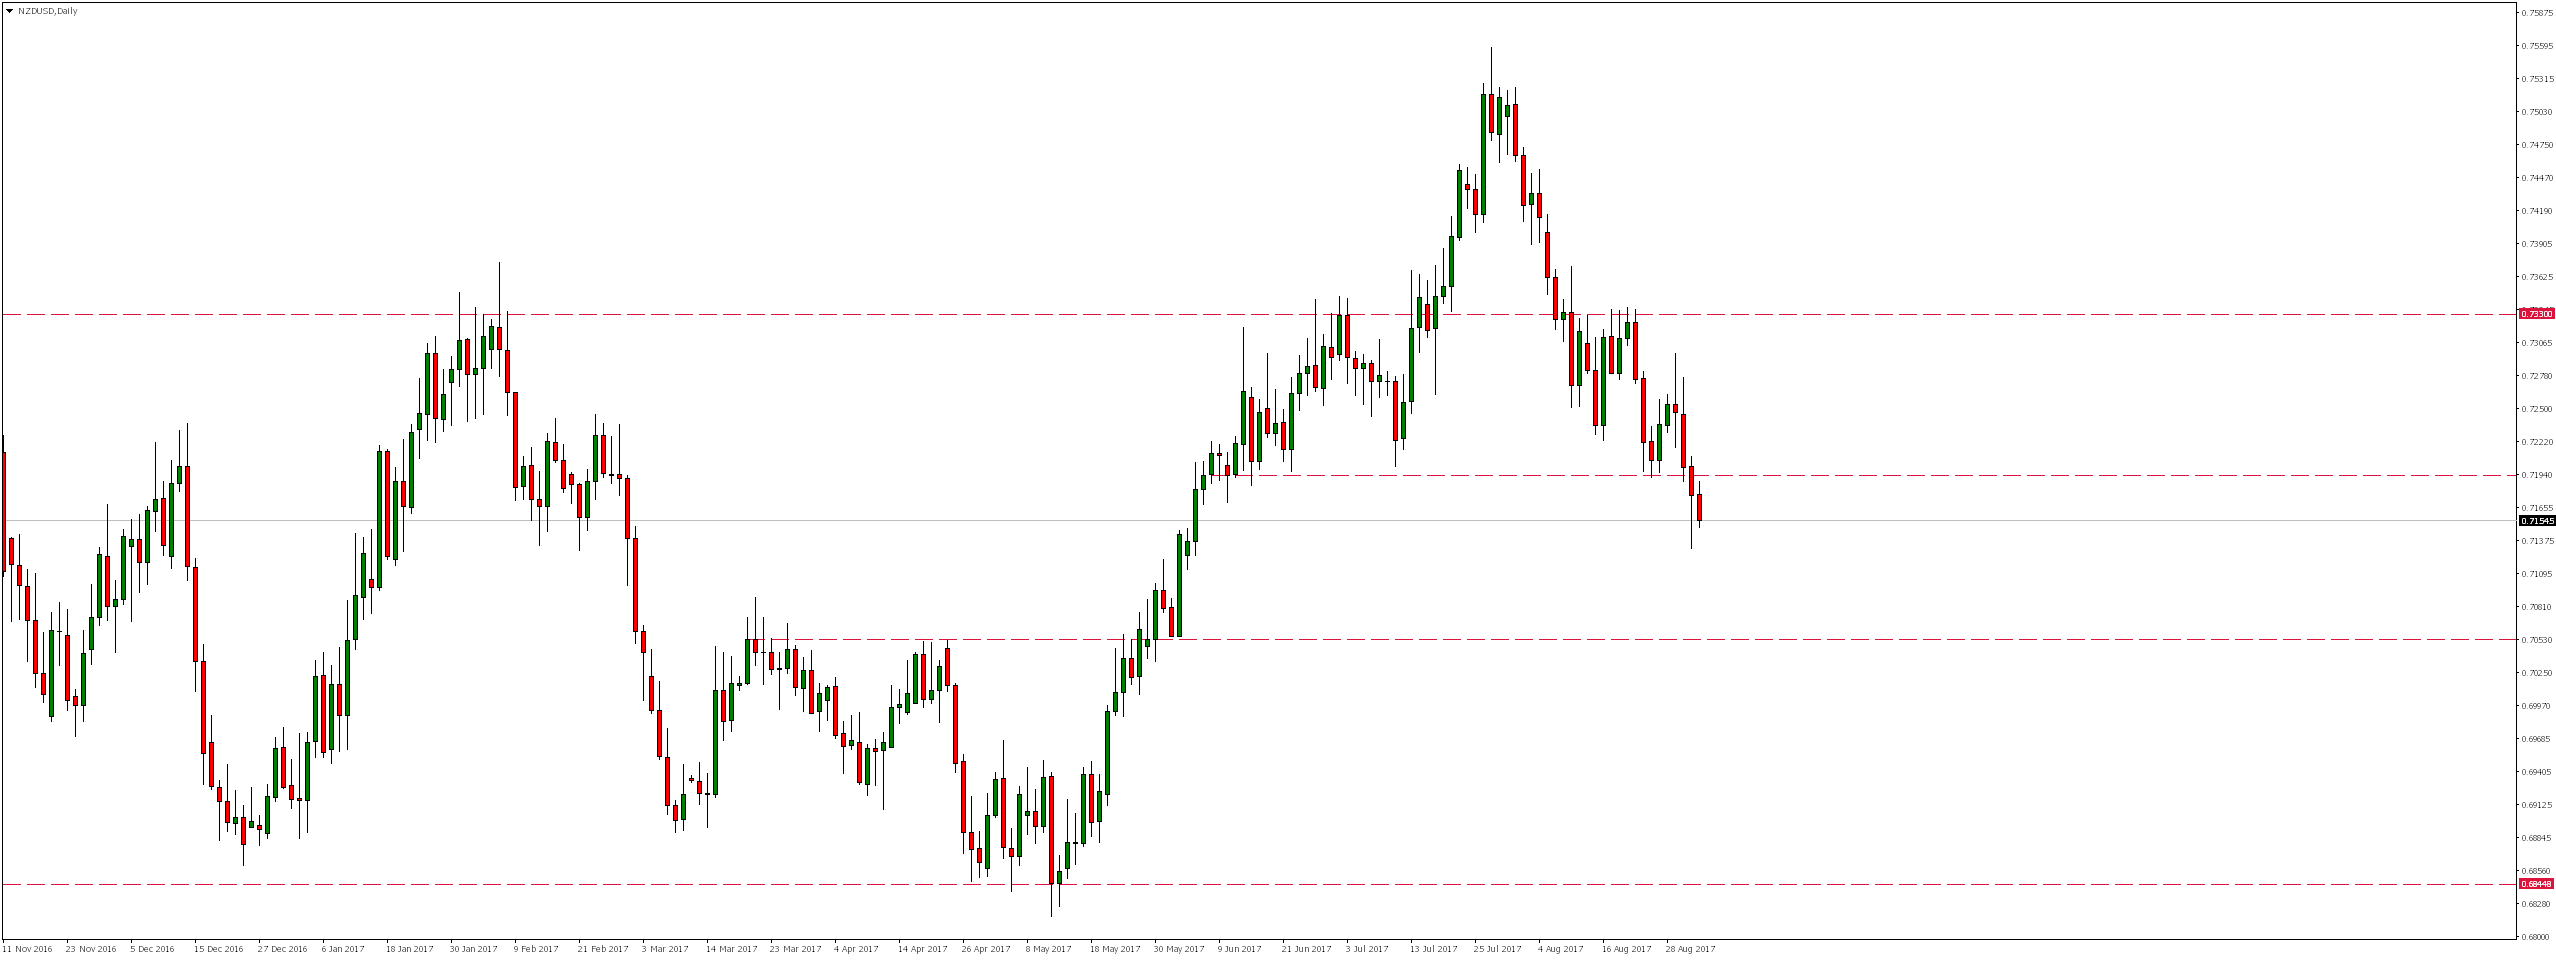
It is also worth noting that according to my yesterday’s projection, as a result of yesterday’s growth, pair reached vicinity of neckline and local resistance 38.2% of the Fibonacci correction. Although this zone has not been thoroughly tested, there has been a strong supply response in its vicinity. If in the near future the market will break yesterday minimum, we could expect continuation of declines. This scenario can also be expressed by the current situation on the NZDCAD currency pair, which can be read in a separate article.

While investing on instruments correlated with the US dollar should be remembered scheduled for the hour. 14:30 NFP publication, which can cause greater volatility on pairs with USD.


