From investor to scalper is an analysis cycle in which we take one financial instrument each day and the analysis include a detailed look at the value from the monthly/weekly chart to the H1/M15.
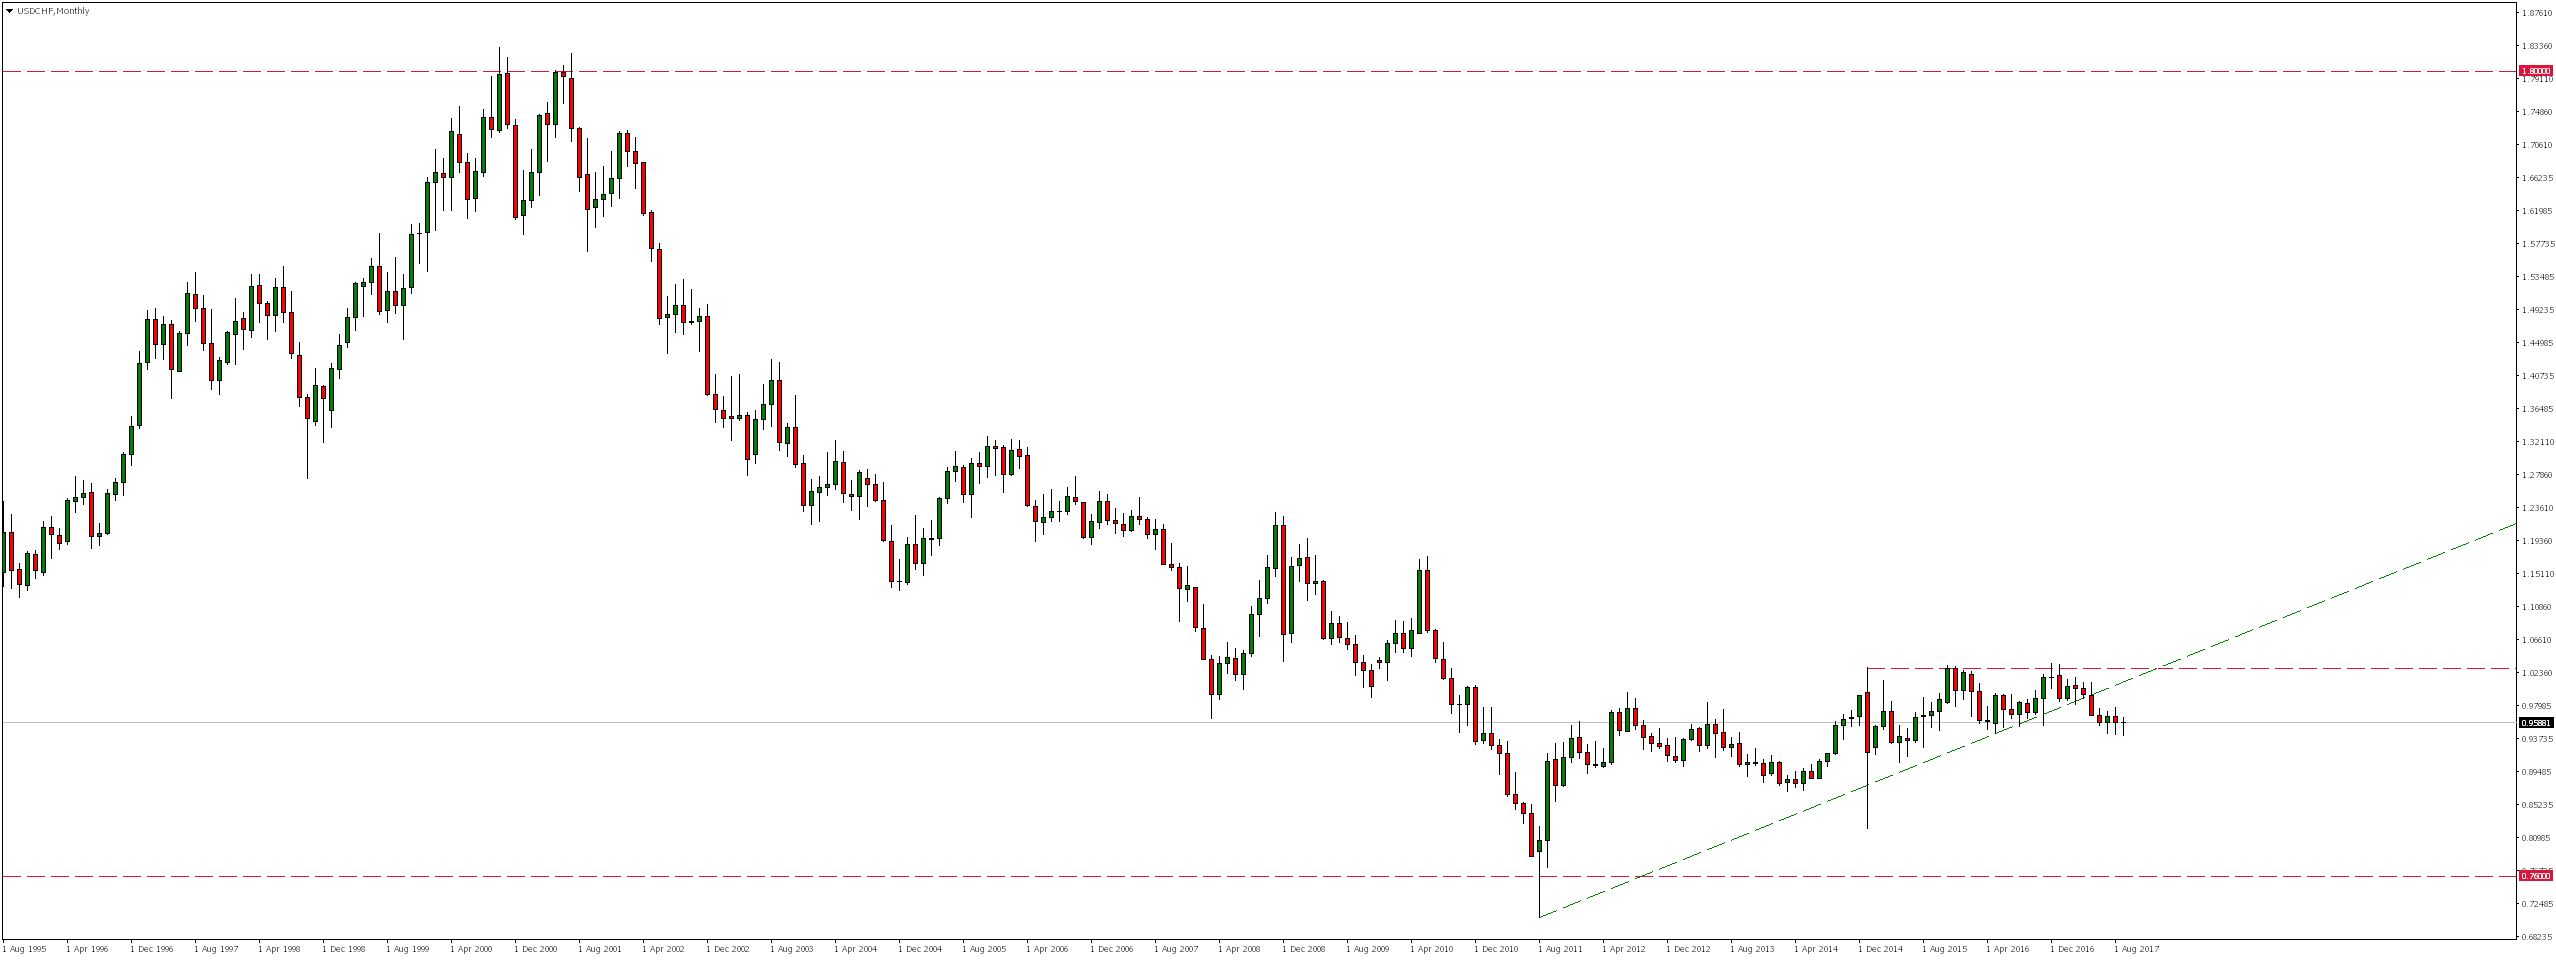
USDCHF as a result of a double-top formation that denied the 1.8000 level since June 2001 moved south. After ten years, these drops reached vicinity of 0.7600, where a strong demand response occurred in August 2011. From that time on, we watched a calm growth, forming a rising wedge from which we broke down in May.
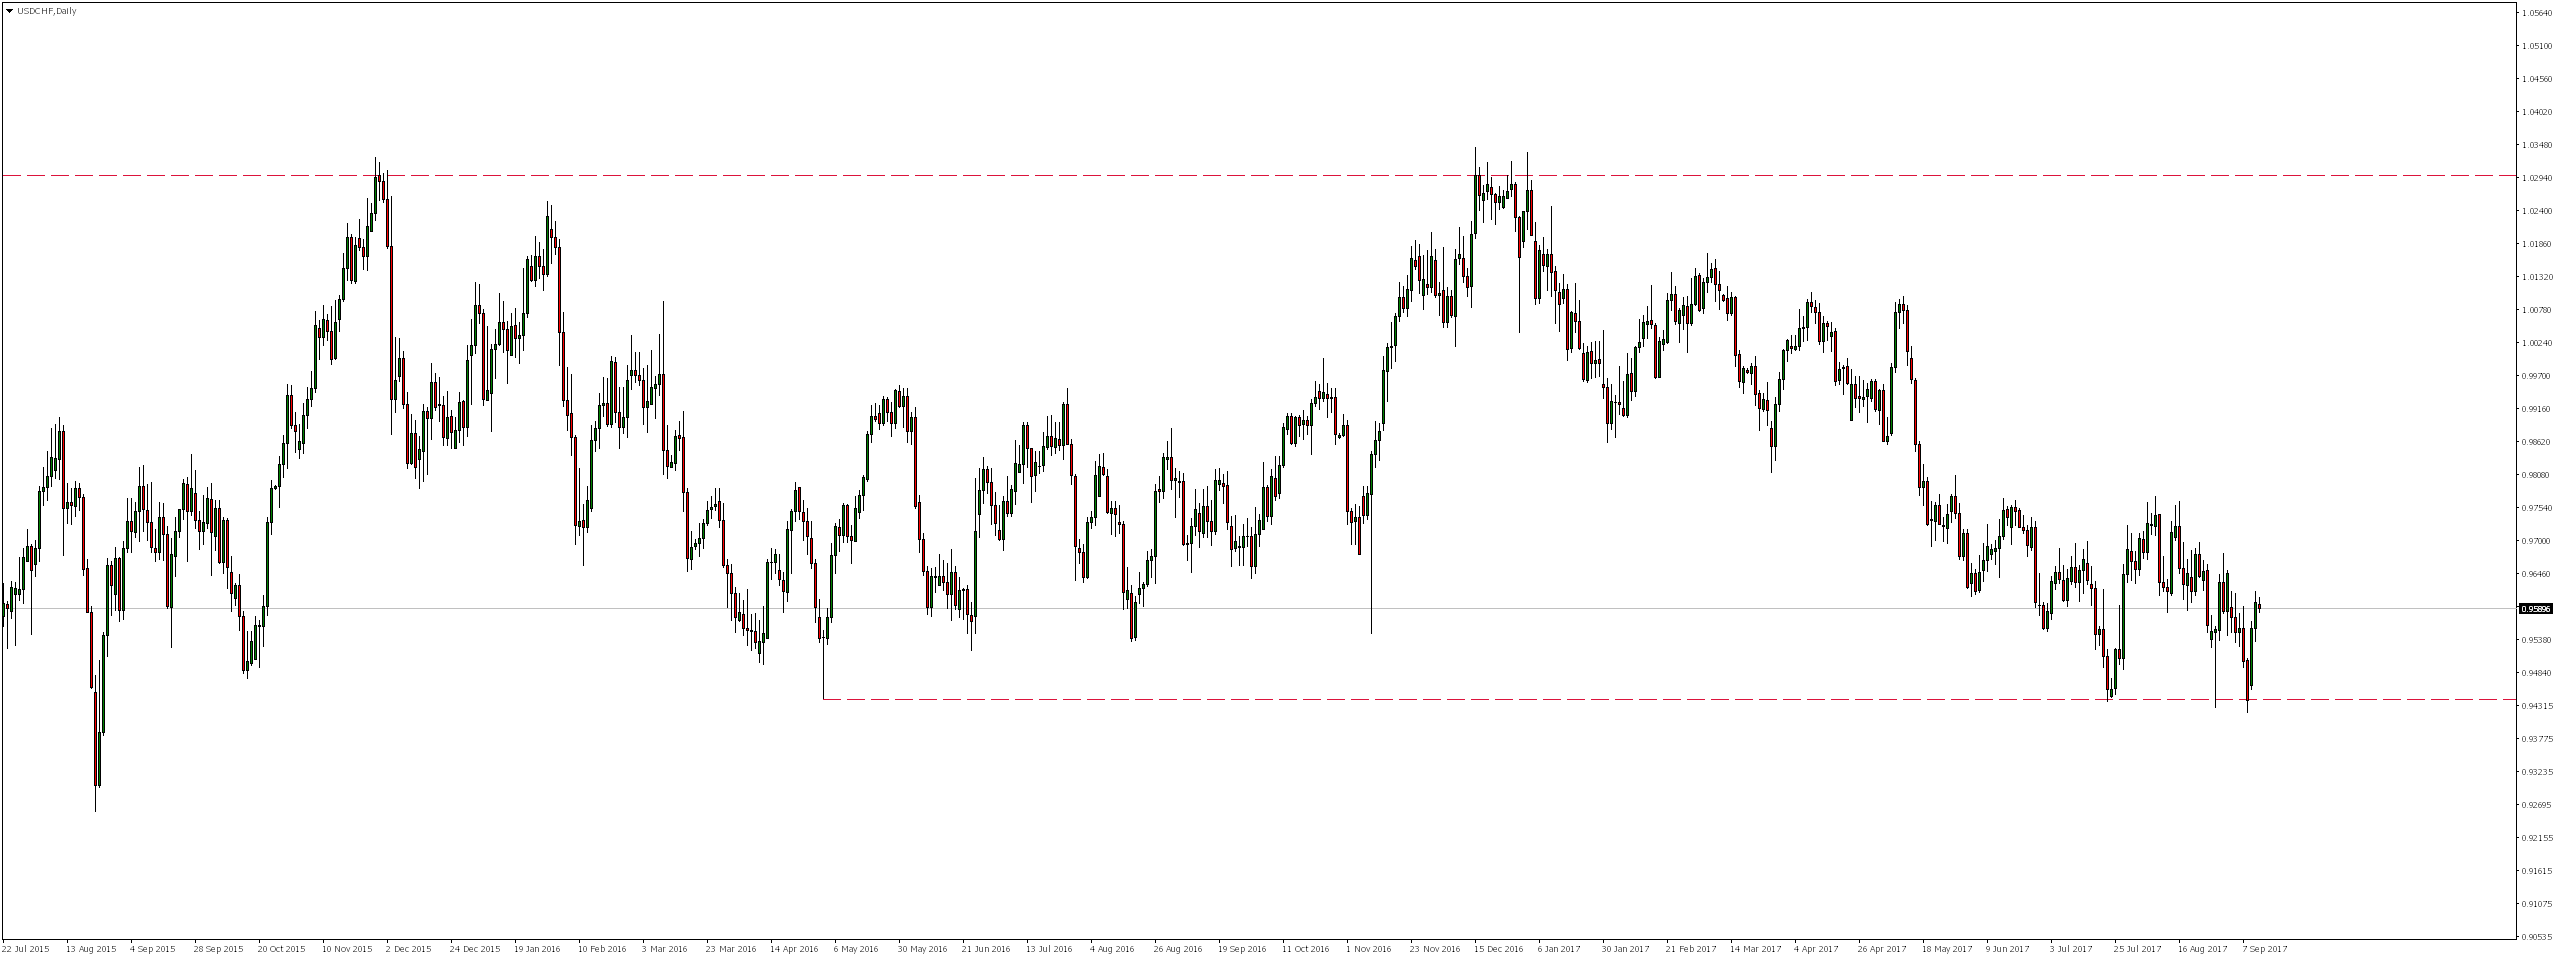
Looking at the daily chart we will notice that the market has been moving for a long time in a horizontal trend. As a result of declines from the beginning of the year, pair reached lower limit of this consolidation, where already at the end of July the first demand reaction appeared. In spite of this, later gains reached only area of 38.2% of the Fibonacci correction from previous falls. Since then, the rate has double-tested support – the bottom of consolidation, and there is a demand response every time.
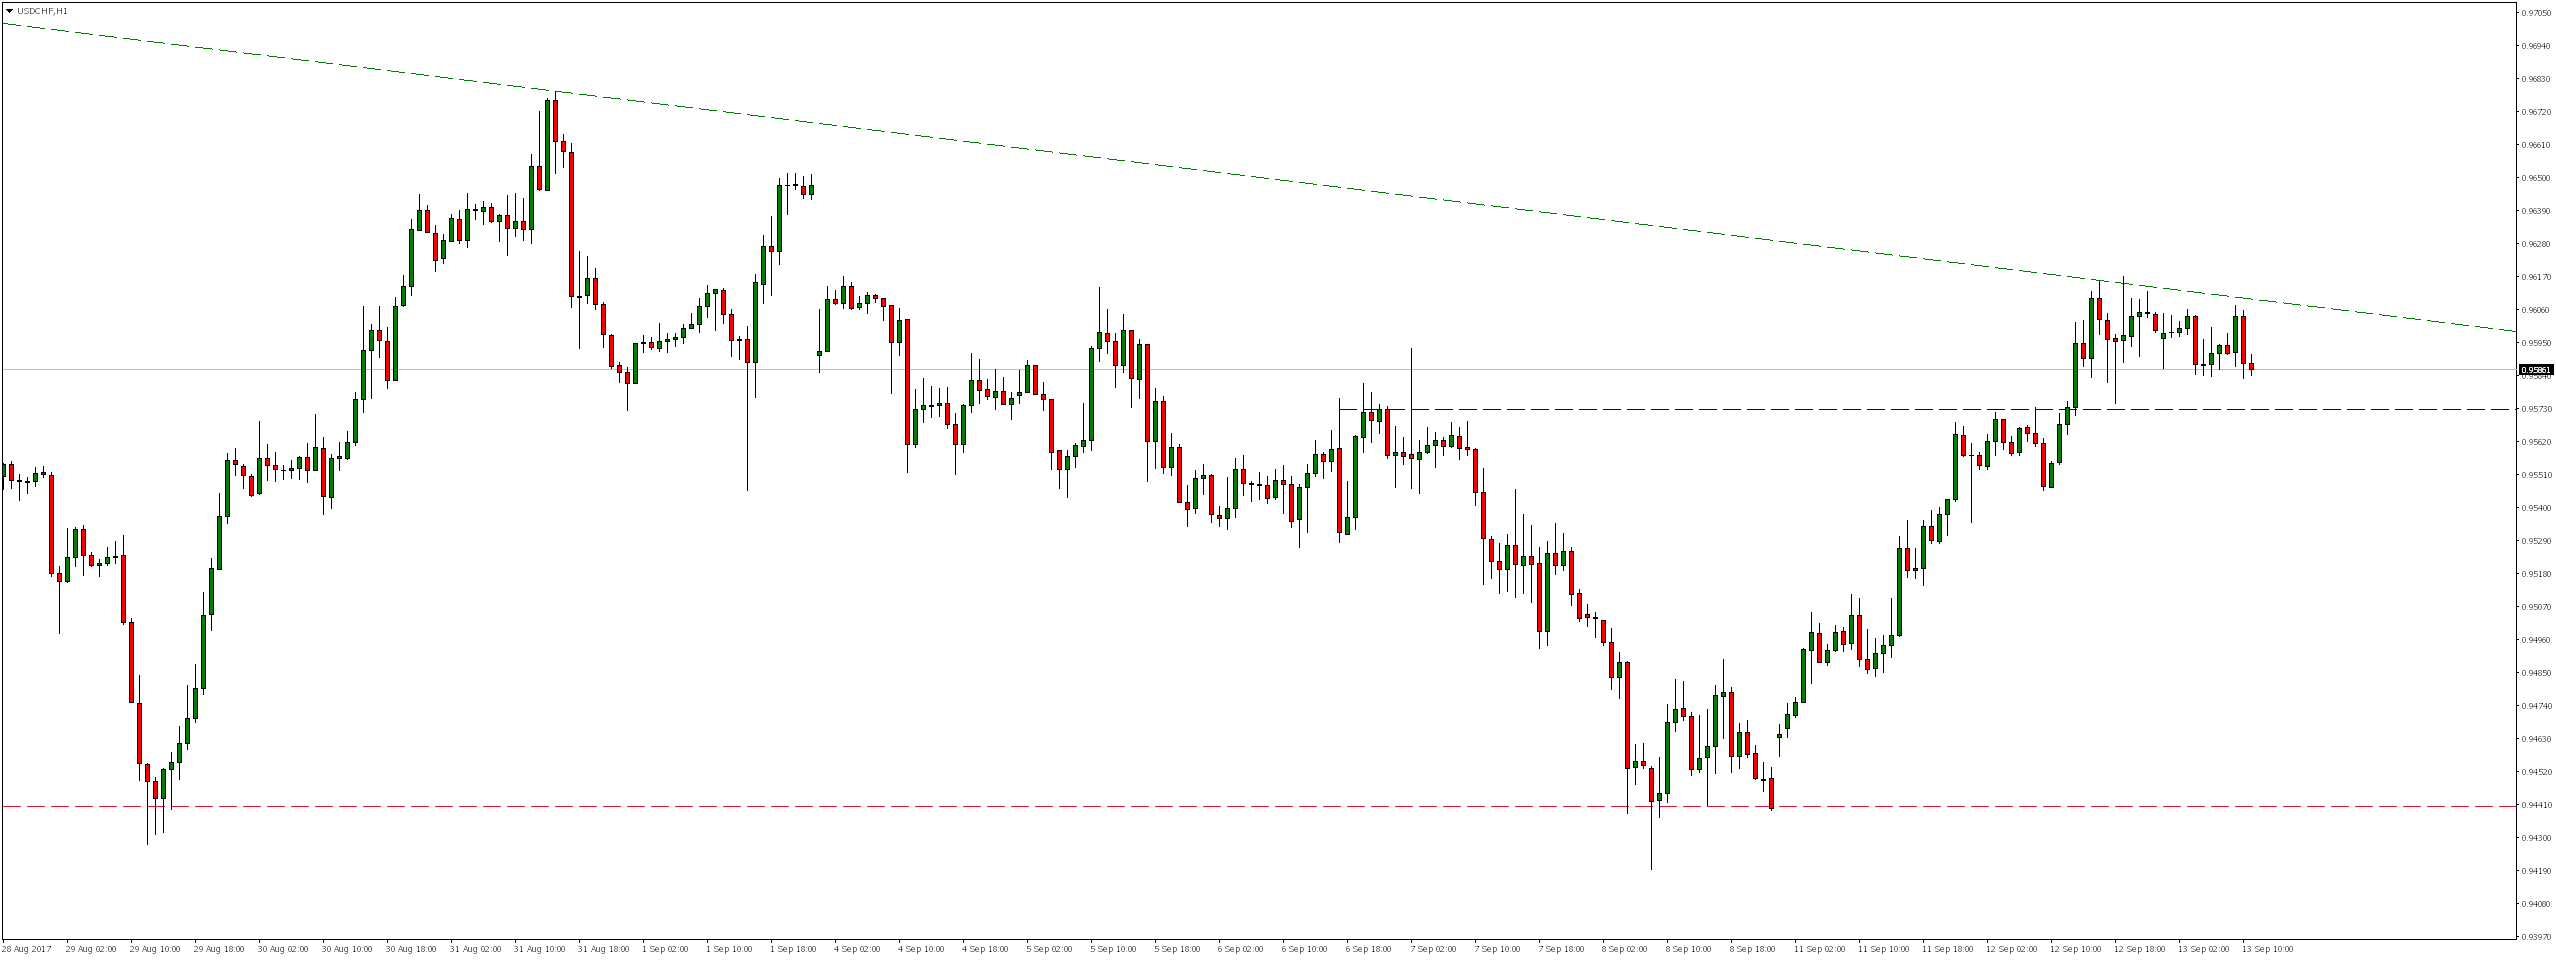
On the H4 chart, we notice that the market has been creating a slightly more narrow consolidation, whose upper limit is around 0.9760. So if the upward momentum continues, in the nearest future we might be able to test the resistance again.
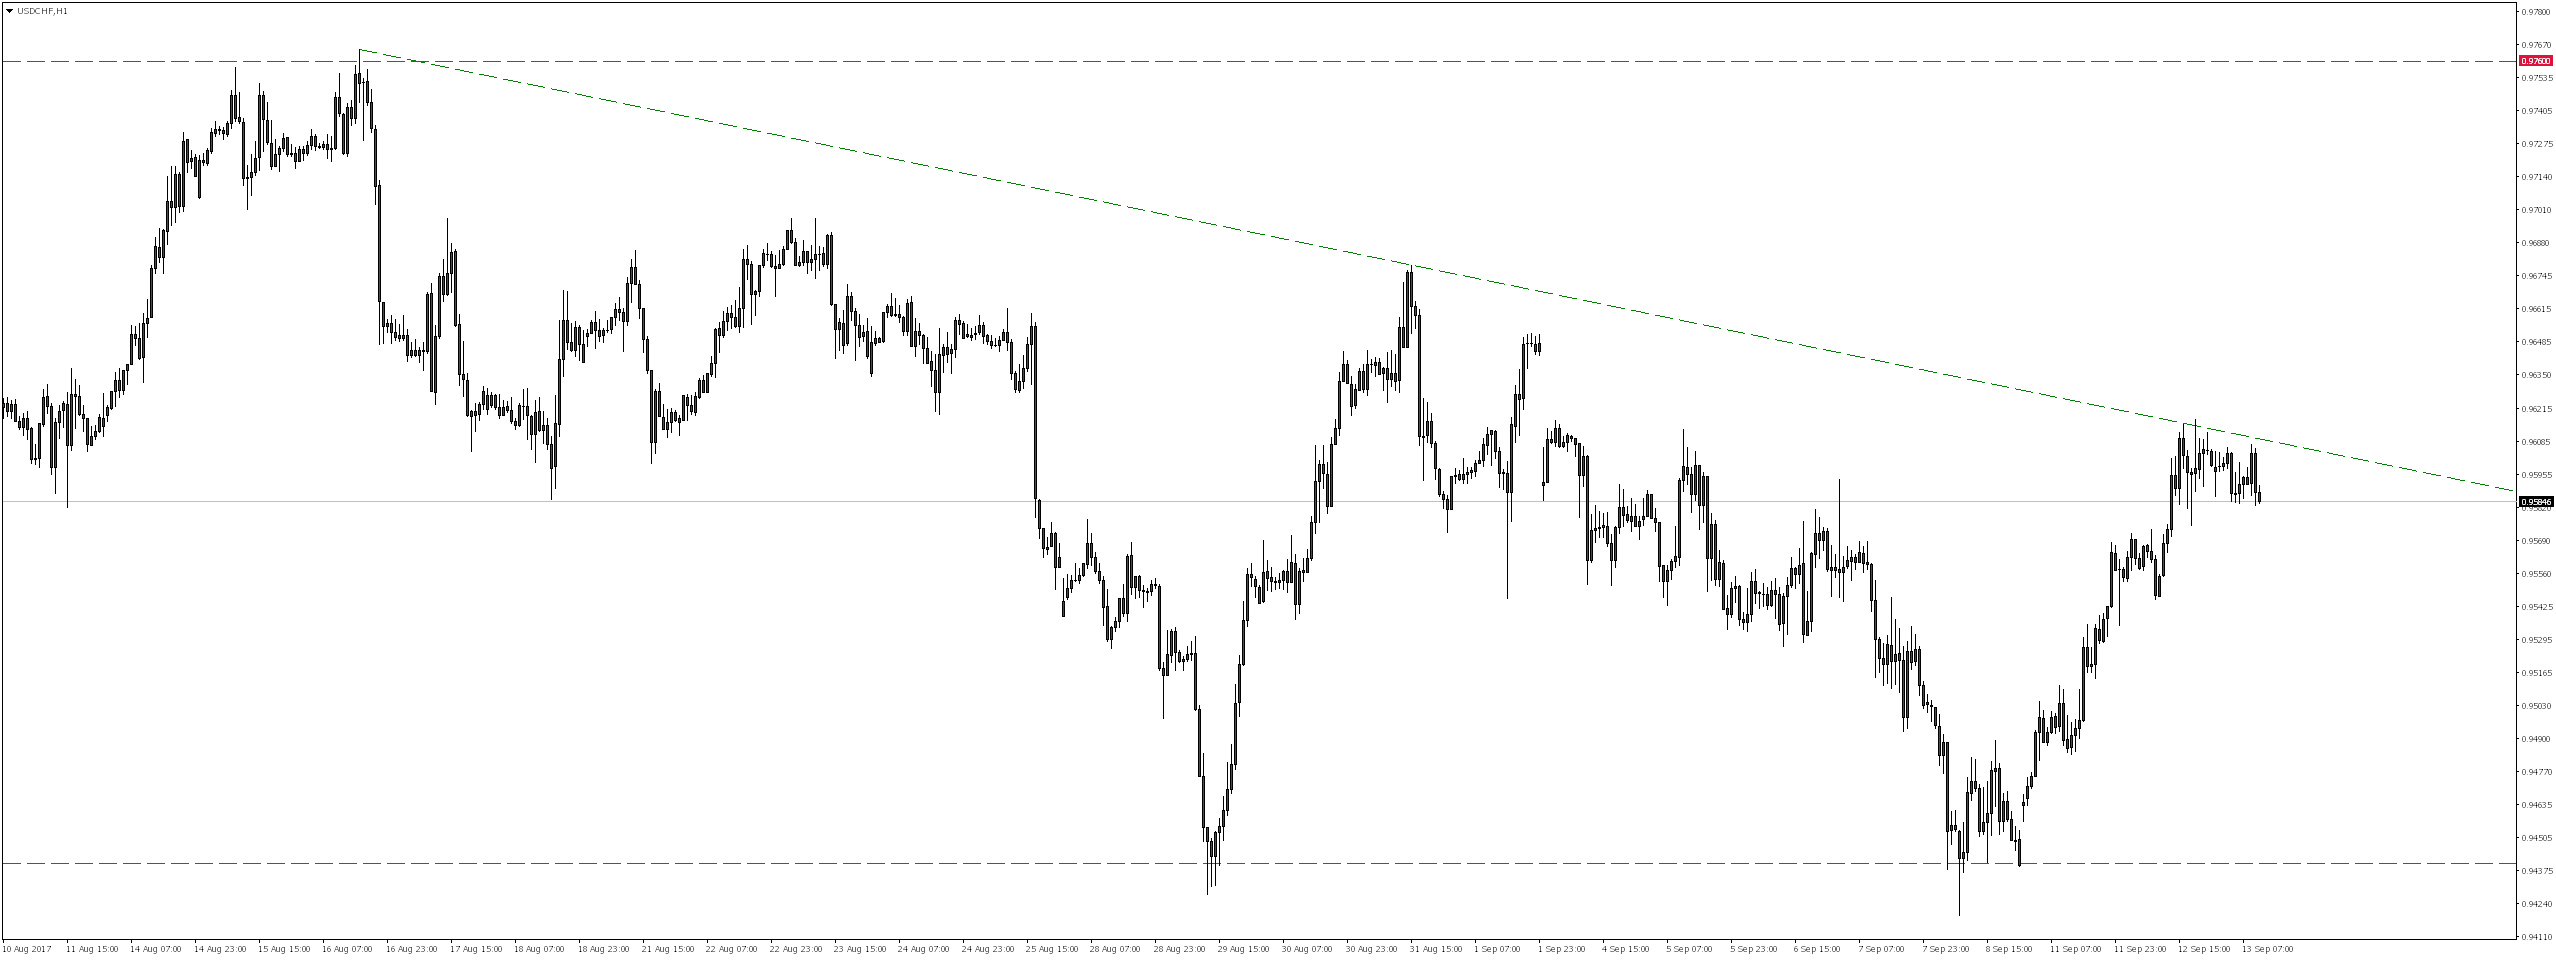
Probaly before it happens we will witness re-test of the recently defeated, local (blue) resistance (now support).
![]()
![]() STO is a broker regulated by FCA and CySEC. It offers more than 300 financial instruments such as Forex, Indices, Oil, Stocks, Commodities and Bonds. STO clients have possibility to trade thanks to reliable MT4 and AFX FAST platforms. Check STO offer!
STO is a broker regulated by FCA and CySEC. It offers more than 300 financial instruments such as Forex, Indices, Oil, Stocks, Commodities and Bonds. STO clients have possibility to trade thanks to reliable MT4 and AFX FAST platforms. Check STO offer!


