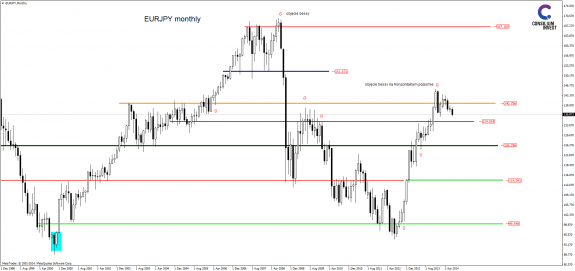
 For the beginning, we suggest to try some exotic perspective which a monthly chart gives. The interesting news is the fact that the current Price Action signal is a bearish engulfing pattern on the horizontal resistance level near 141.00. The second information is that, if the support 135.00 does not stop corrective movement, we do not see any horizontal reference points until the next support at 126.00. Of course we have to treat market view from so-distant prospects only as a supplement to further analysis.
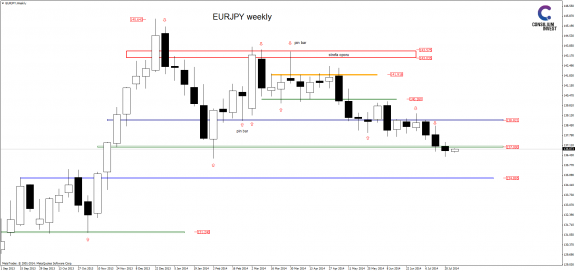
The basic fact of current technical situation is a several resistance confirmation in the vicinity of 138.80. In the past two weeks the local support 137.00 was a big dispute, and we can see a market indecision, which is illustrated by the lack of correction. For this reason, the correction within the zone 138.80-137.00 looks equally likely as a continuation towards 134.90.
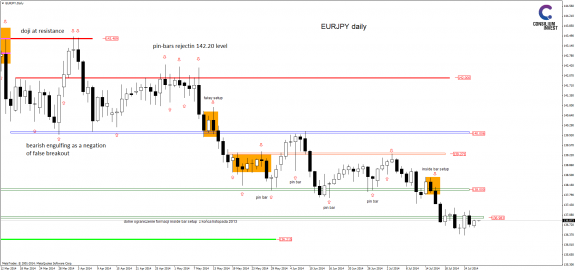
Daily chart confirms this picture of the market. After a sluggish break below 137.00, price made a return movement and stopped there. Sustainability of the current downward momentum suggest to wait for the correction and look for opportunities to join bears. We note, therefore, that the nearest resistance is a boundary of 138.00. The next one can be seen at 139.30.


