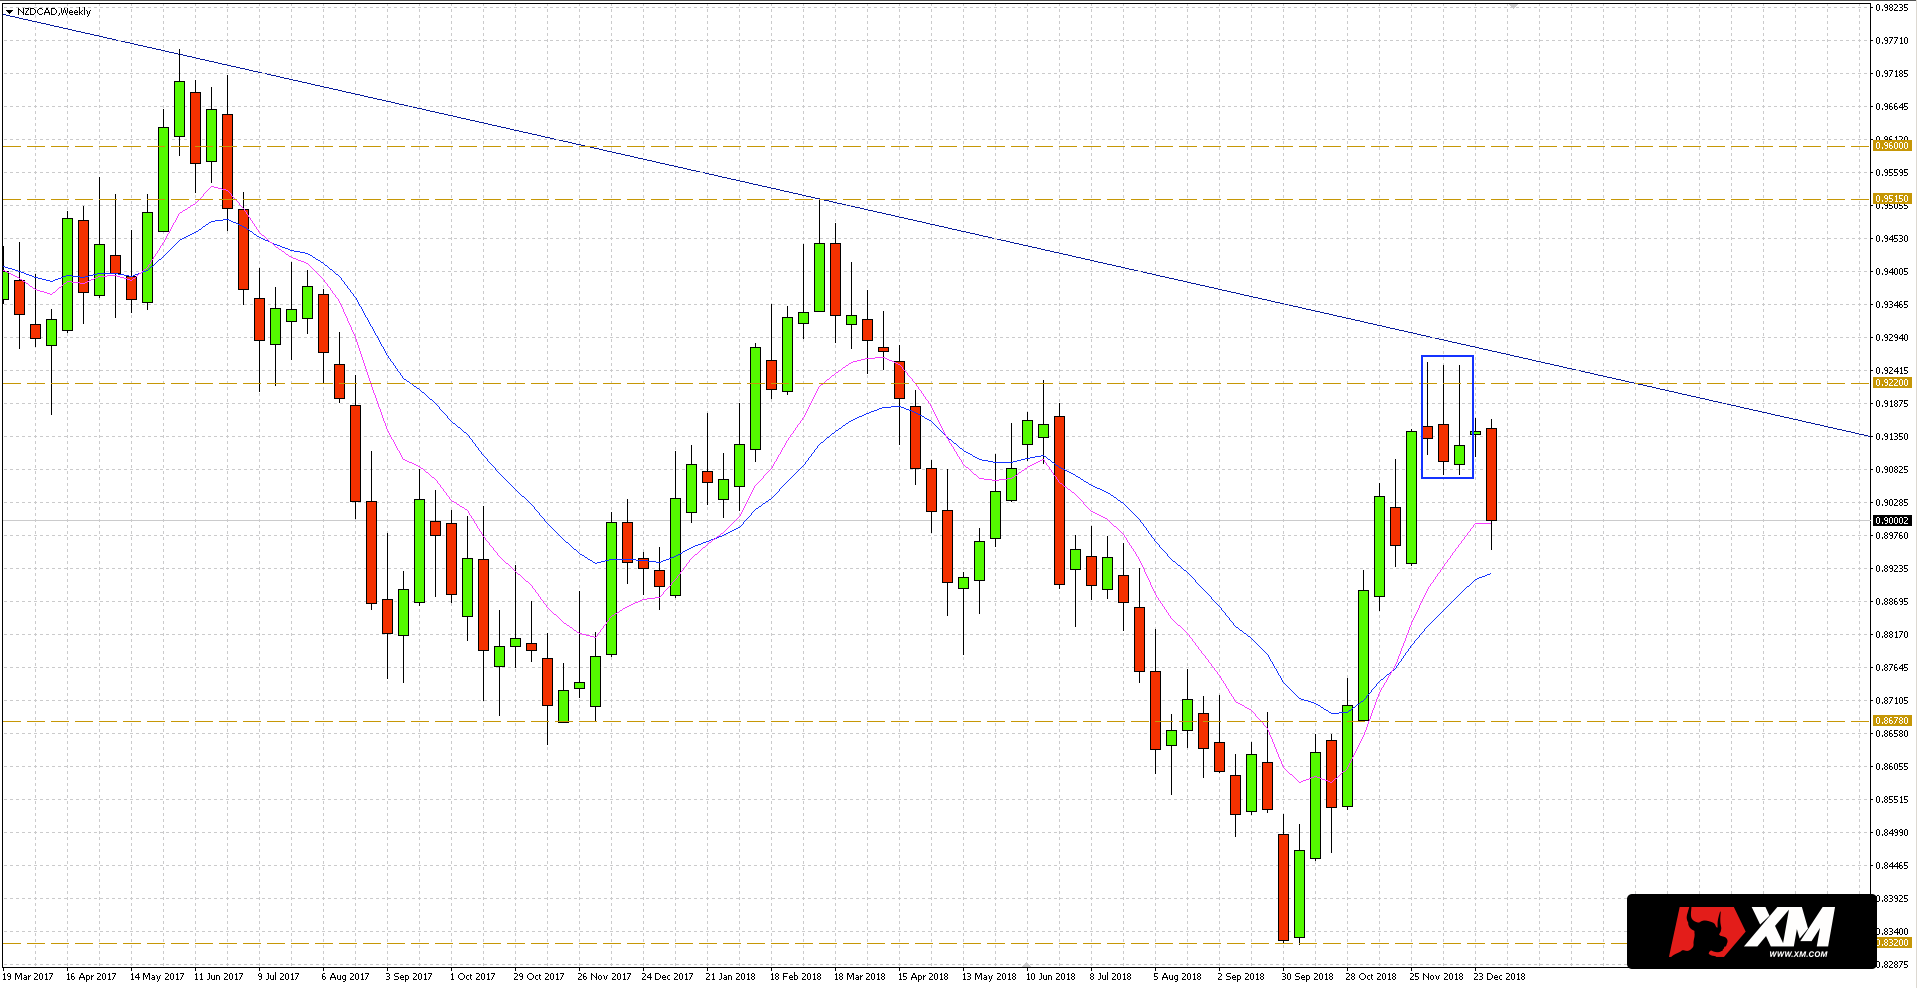
The last time I looked at the NZD/CAD currency pair on 20th December. It was also then that my attention was attracted by candles on the weekly chart, which was characterized by long, upper shadows and small bodies. Usually, they suggest a potential for declines, at least corrective ones.
In addition, these candles were formed in a specific place. They tested the key resistance of 0.9220. However, there was a need for additional confirmation of a potential correction, which appeared with the first session of the current year.
As can be seen in the NZDCAD daily chart below, Wednesday’s session was closed under the support at 0.9066. Yesterday, in turn, this area was tested as a valid resistance.
The price action described above has the potential for corrective movement in the direction of 0.8670. However, before the price can reach it, sellers still have to overcome the low from 23 November 2018 to 0.8927. Alternatively, setting a new peak will question the pro-declining attitude in the short term.


 Review")


