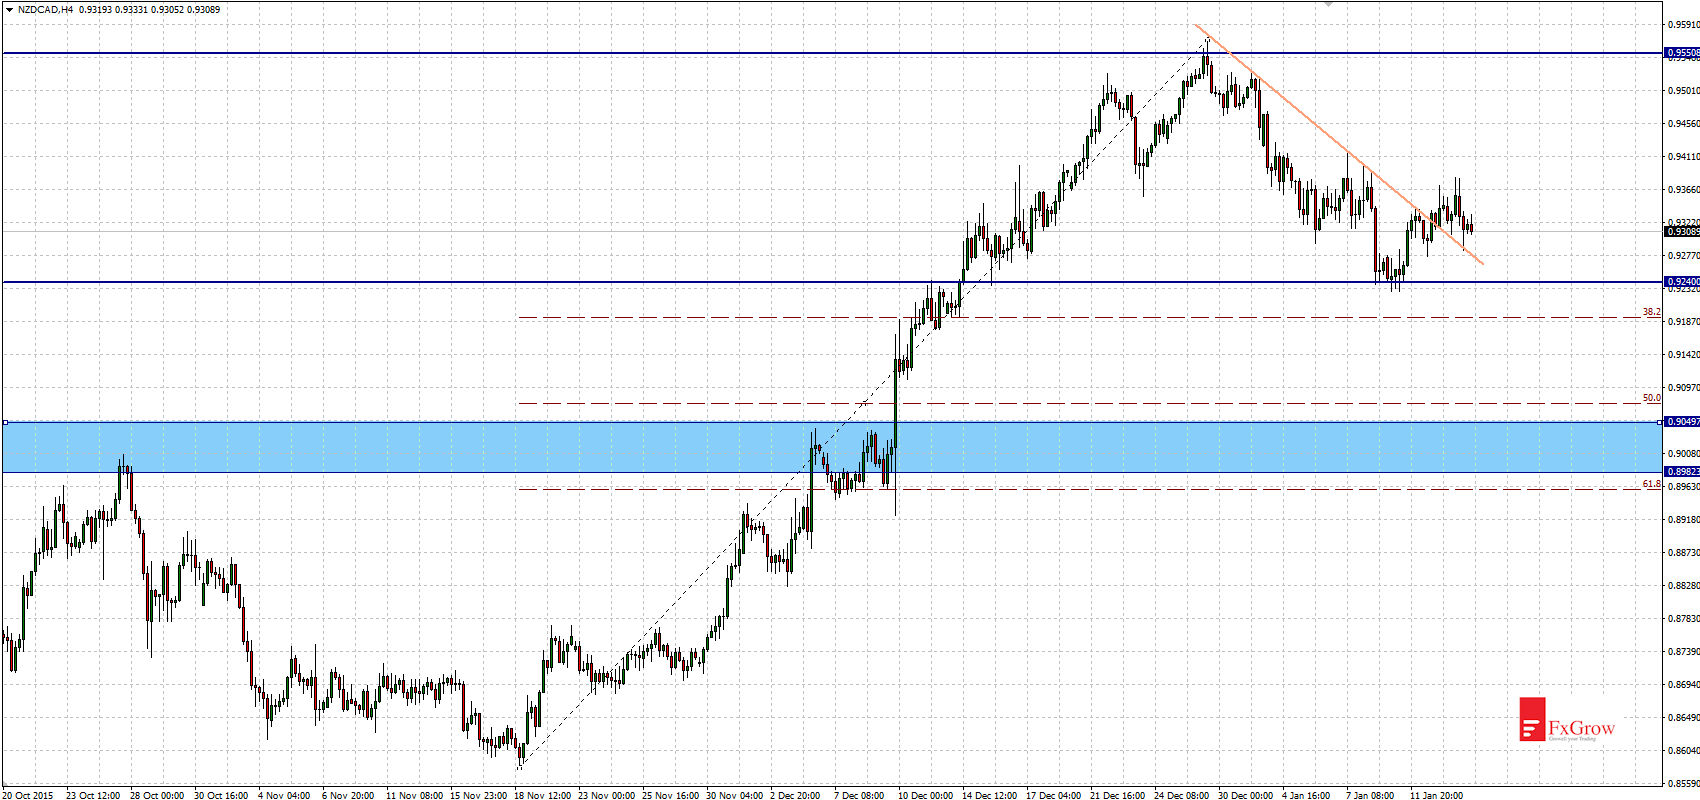
After upward movement lasting 2 months NZDCAD reached resistance, which since 2014 has been causing rebounds. That’s also happened now. For the third time area 0.9550 stopped bulls charge. Falls that occurred doesn’t reach even to Fibonacci 38,2% which could mean that correction isn’t finish.
Bulls could try to return to uptrend as evidenced by broken intraday downtrend line (orange line at the chart). However it shouldn’t be succeeded (December’s high shouldn’t be threatened). If bulls fail, price will come back to correction. When bears return and support at 0.9240 will be broken, it is likely that next target will be found near 0.9000 – 0.9050. At this area supports coincide with Fibonacci levels. Nearest resistances: 0.9380, 0.9470, 0.9550. Nearest supports: 0.9240, 0.9110, area 0.9000-0.9050.
Time-frame H4