On NZDJPY chart price is around resistance and the round level 83.00. The quotes have been moving for a long time in a bullish trend. This is evidenced by sequence of higher peaks and lows. Additional confirmation give EMA’s (75-, 100-period), which are facing upwards. Support test of 82.00 led to increased demand activity. Currently we see a growth impulse.

Access some 200 financial instruments with Noble Markets >>
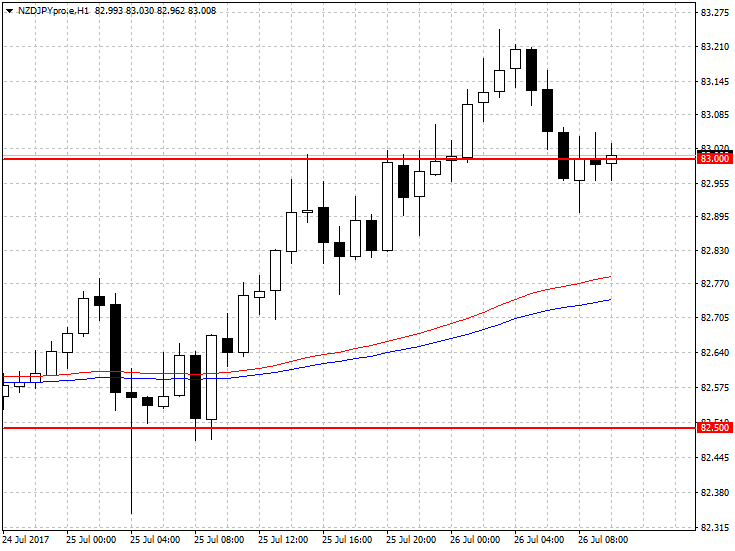
It is worth looking at a chart with a lower time interval. We can see growing demand pressure on H1 chart. Currently quotes are testing a round level 83.00. Lack of demand response may lead to a greater correction and test of local support 82.50. The emergence of bullish formations will increase the chances of breaking the resistance and pave the way to further growth.