NZDUSD – from the beginning of the year moves in a downward trend. At the beginning of October, the pair established a minimum of this year 0.6423. Since then, a noticeable change in moods has been seen and demand has directed quotations to the north. 1.11. there was a dynamic breakout from the bearish channel and continuation of increases.
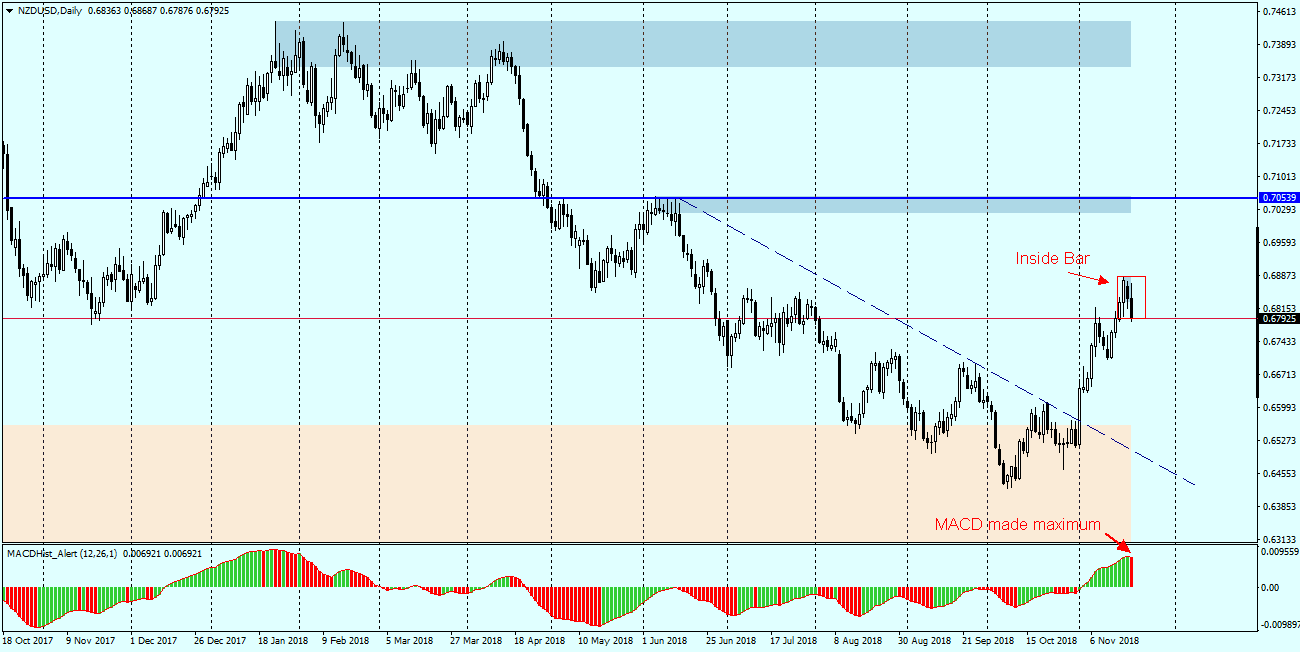
This week (chart D1), Monday’s quotations were within range of the preceding day candle from Friday, creating the formation of Inside Bar. Today the lower IB limit has been slightly overcome and the daily candle has created the maximum on the MACD oscillator. This may herald further declines.
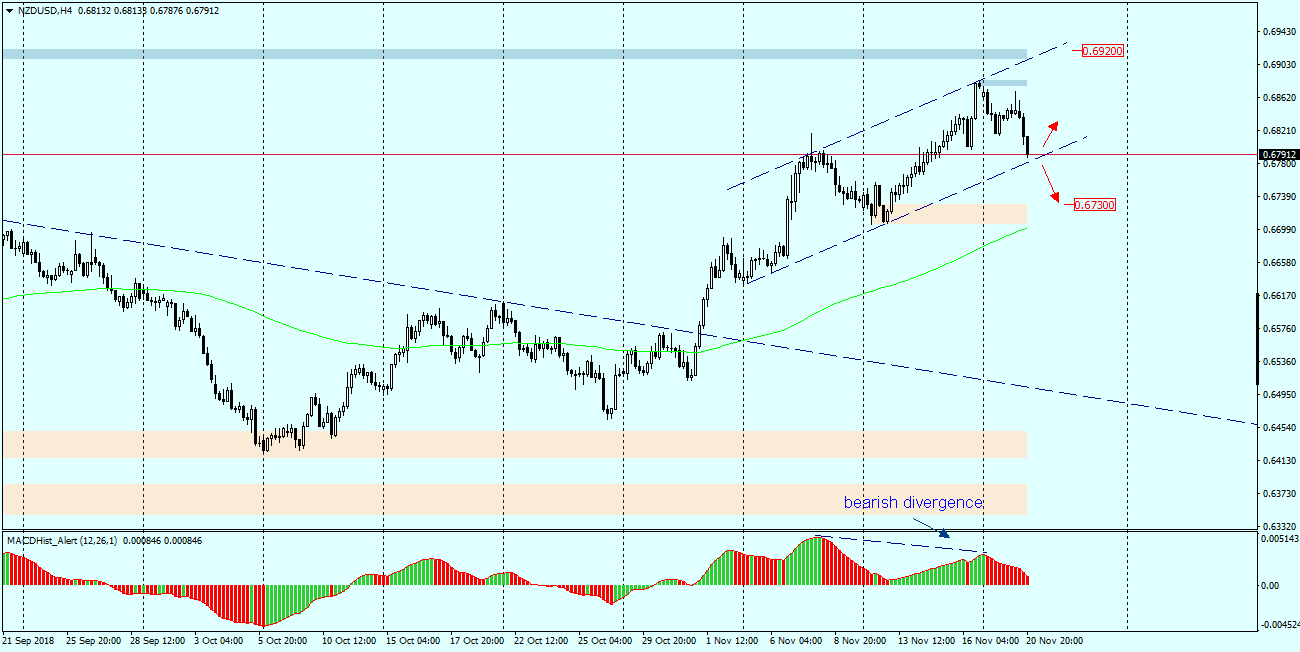
When we look at the H4 chart, we notice that from the beginning of this month the quotes moved in a growth channel. Overcoming its lower limit (channel support) will open the way to the nearest support at 0.6730. The ongoing bearish divergence supports the downward scenario.
Join us for new analyses and education content
https://www.facebook.com/groups/


