When doing a technical analysis of a currency pair or some other financial instrument, we should try to find on the chart as many formations as possible that will strengthen our belief that the instrument will behave in line with our expectations, frankly said we look for confluence. Confluence in this case is nothing more than additional confirmation, which strengthens important level or direction in which the price can move.
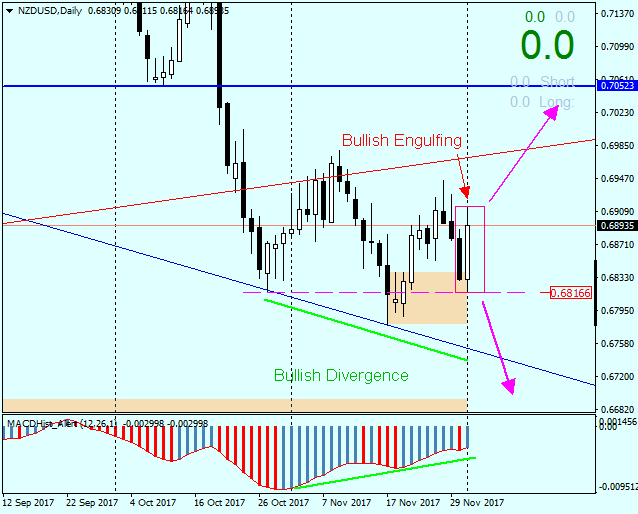 NZDUSD – Friday’s daily candle (1.12) engulfed Thursday’s forming Outside Bar formation – Bullish Engulfing with the range 0.6912 / 0.6815 (High / Low).
It is also worth paying attention to the divergence (green lines) between MACD and price – in this case also a bullish signal.
Additionally, on the graph we can find a pro-growth invert Head and Shoulders formation, where the left and right arm are on the same level of 0.6815.
In this situation, we have at least 3 hints suggesting that NZDUSD will go north.
The answer to the question where we could join the bulls can be level 0.6868 which is currently the nearest level of support and you can look for a signal to buy in its vicinity.
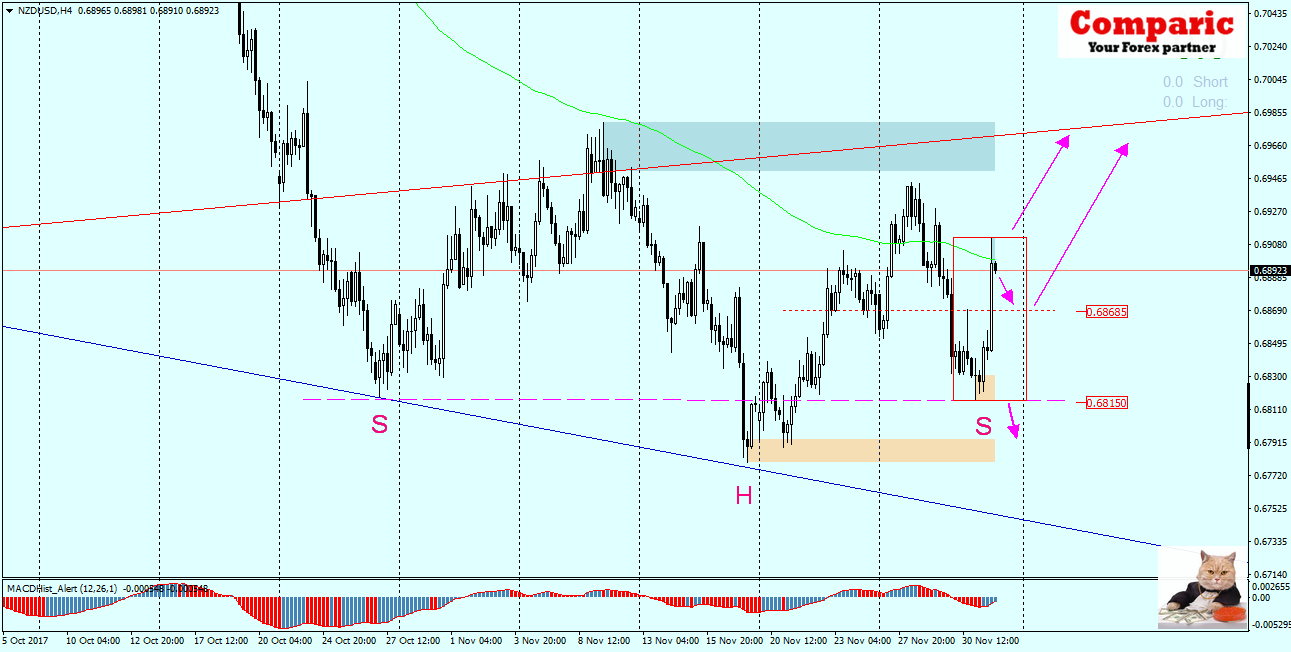
If, however, the market would ignore our considerations and go to the south leaving Outside Bar by the bottom (breaking the iH&S arms line) and would overcome the support resulting from the last local minimum of 0.6765, this analysis can be considered as invalid.
From macroeconomic events this week that may affect pairs with the dollar – we must keep in mind changes in taxes favorable to entrepreneurs adopted on Friday evening in the US. It passed by 51-49. Its shape can strengthen the dollar this week.


