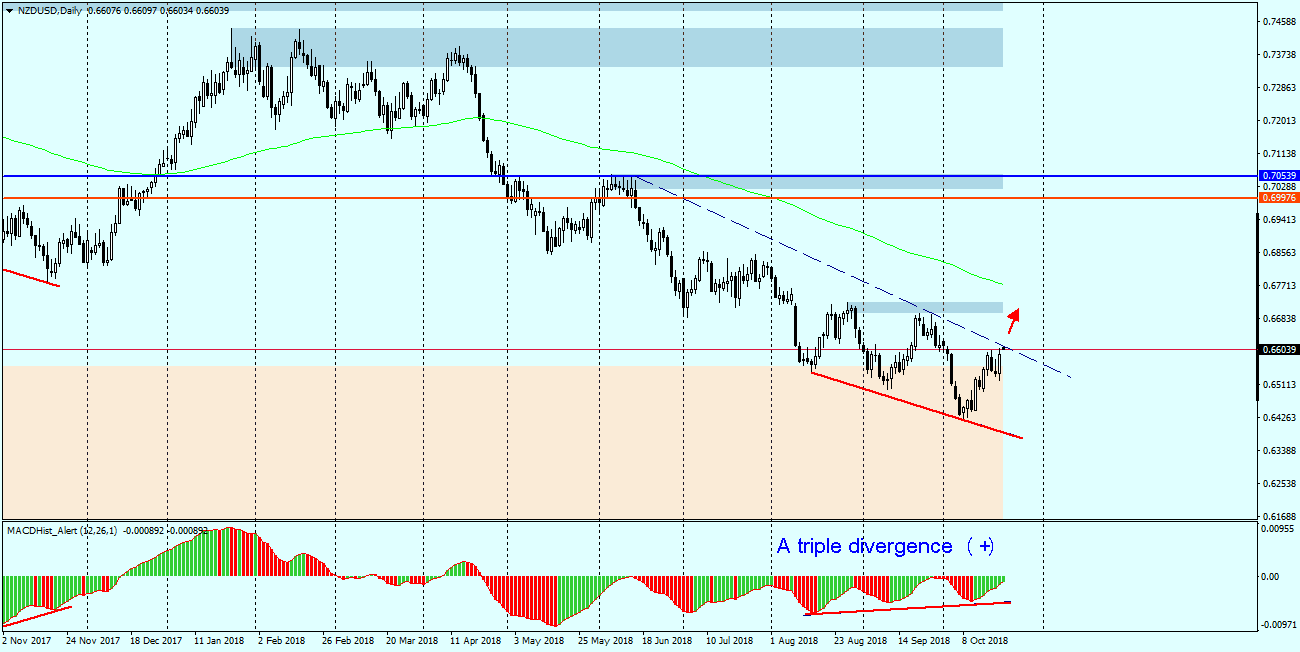
NZDUSD – from April this year moves in a downward trend and during this time quotations dropped by nearly 1000p. On Friday the price reached the line limiting this move from the top constituting the resistance line of this trend. Overcoming it can be an impulse for further increases. The MACD indicator shows upward divergence, which supports the growth scenario.
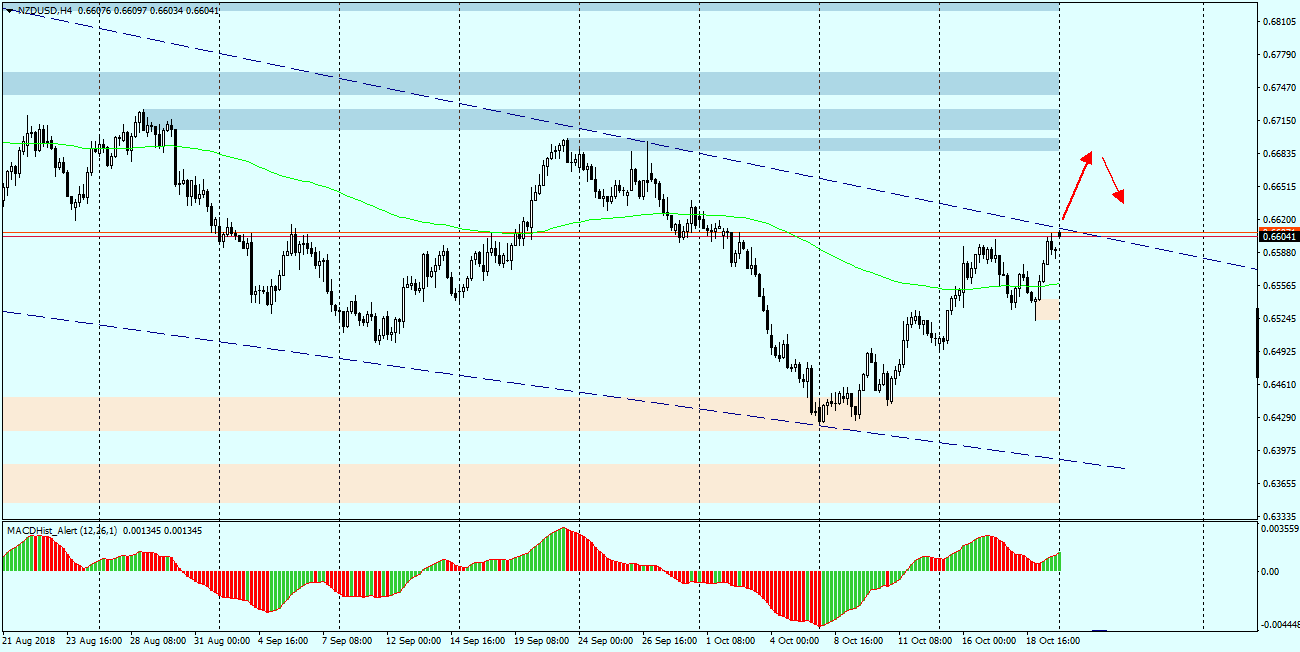
When we look below at the H4 chart, we can determine the closest target of possible increases, and it will be the supply zone at 0.6680-95. The MACD oscillator should be observed, in the case of a lower (red) bar and the creation of maximum, a bearish divergence (-) may occur, the price may not reach the said supply zone and start to reverse. In the event that the pair does not deal with the trend line and the MACD starts to decrease, it will be a confirmed strong sell signal.