We invite you to read the previous analyzes: Analyses game with swap
Awarded a triple swap points today in the broker XM.
EURTRY
|
Instrument |
Punkty swap (długa) |
Punkty swap (krótka) |
Wartość swap w zł/lot (długa) |
Wartość swap w zł/lot (krótka) |
|
EURTRY |
– |
60.5 |
– |
87.2 |

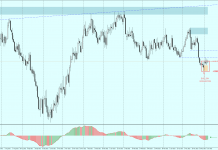
On the daily chart after testing important resistance arises candle pin bar, which looks very attractive, increasing our positions on this pair, set a reasonable S/L in the vicinity of 2.93 and T / P in the vicinity of 2.72.
NZDUSD
|
Instrument |
Punkty swap (długa) |
Punkty swap (krótka) |
Wartość swap w zł/lot (długa) |
Wartość swap w zł/lot (krótka) |
|
NZDUSD |
5.8 |
– |
16.3 |
– |

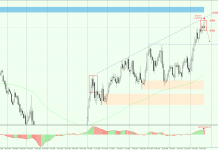
On the weekly charts, we see the fulfillment of the standard correction, test support and the trend line, it appears that the creates a pin bar candle.

On the daily chart formed a pin bar candle which tells us about the finished of correction. We are open a long position, which has a very favorable ratio of Risk to Reward. We set reasonable S/L in the vicinity of 0.84, and T/P in the vicinity of 0.87.
USDPLN
|
Instrument |
Punkty swap (długa) |
Punkty swap (krótka) |
Wartość swap w zł/lot (długa) |
Wartość swap w zł/lot (krótka) |
|
USDPLN |
– |
8.5 |
– |
8.5 |

Pair tested important resistance appeared candle pin bar. We are open small short position with a reasonable S/L in the vicinity of 3.17 and T/P in the vicinity of 3.06.
USDTRY
|
Instrument |
Punkty swap (długa) |
Punkty swap (krótka) |
Wartość swap w zł/lot (długa) |
Wartość swap w zł/lot (krótka) |
|
USDTRY |
– |
46.6 |
– |
67.9 |

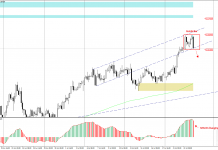
On this currency pair price reached our level of S/L, swap points covered about half of the loss. We analyze the currency pair because we have a very interesting situation. This is exactly the “false breakout” according to the theory drA.Elder. Oscillator MACD confirms it. We look forward to going down prices below the red line marked on the chart and a sell signal. If this scenario will occur, we are open a short position with a very good ratio of Risks to Reward. (Level S/L we are set above the top on the daily chart and T/P in the vicinity of 2.03)


