Basics of Price Action trading strategy
„What is Price Action?” is a question asked by many beginner traders. If we answer this question, that this is „price action in time” or similar, these traders still can have big concerns about understanding definition and trading using Price Action. In this manual we will show examples of the charts, which can illustrate this strategy and ways of using it.
Ready? Let’s start.
In the beginning we will talk about basics. On the chart below we have examples of few main concepts used in describing Price Action strategy:
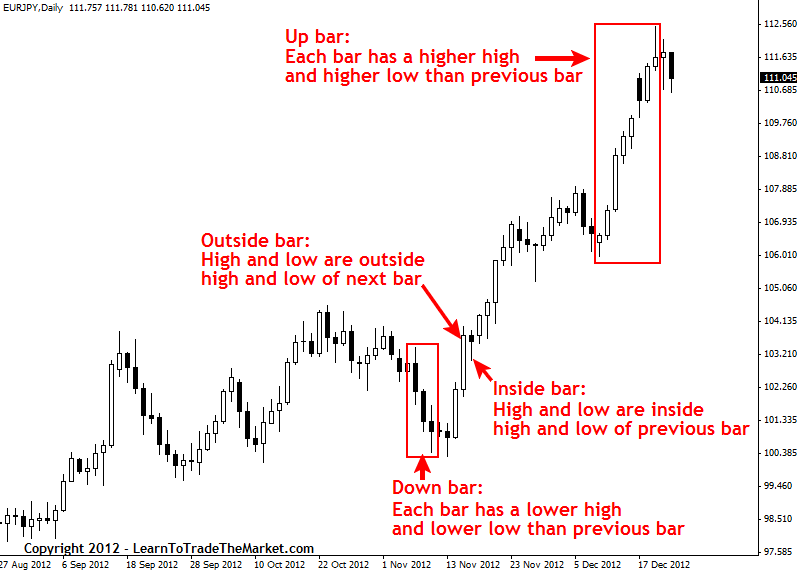
Warning: The term „candle” is connected with trading on candle charts and the term „bar” with pin bar charts. Both chart types show the same information in a slightly different way, just pin bar chart does it in a slightly less illustrative way, but I use words „candle” and „bar” as synonyms.
- Up bar or „bullish” one is a bar which has higher top and higher minimum than the bar directly before. Up bars showed on the chart above create uptrend. Generally it is said that bar is upper one when it closes higher than it opened. In the example above you can see that in the marked area there is also black colored bar, which means that it has closed below its opening. In this case we can assume, that this black candle is also upper one, because its top and minimum are above top and minimum of the previous bar. It is a sign of strong trend and buyers (or „bulls”) are still dominating.
- Down bar or „bearish” one is a bar which has lower top and minimum than candle just before. Pay attention that in the example above bars are closing below openings, which is typical for down bars but it is no necessary, like it was with up bars. Down bars means, that the sellers (or „bears”) are dominating.
- Inside Bar is a candle sometimes called the smaller range bar. Its top is below the top of the previous bar and its minimum and above the minimum of this bar. Some people are strict with this definition and they believe that if even one of the candle ends is even with the bar before, it is no longer an Inside Bar, but for others it doesn’t matter. Creating Inside Bar is a sign of lack of decision on the market. Like with any other kind of bar, the range between its opening and closing price shows strength of indecision, because neither buyers or sellers do not dominate.
- Outside Bar is a covering bar, sometimes also known as Enfulging Bar, it has big range and its top is higher than top of the previous bar and its minimum is below minimum of the bar before, which means it „covers” or „enfulge” the neighbor candle. In the chart above close of Outside Bar was just a little higher than opening price, so it means that the buyers were dominating.
If the opening is in the bottom 1/3 or even 1/4 of all candle, and its close is in top 1/3 or 1/4 of it, this kind of bar is called upper covering and it means that the buyers are dominating. On the other side, if opening is in top 1/3 or 1/4 of candle and close is in the bottom 1/3 or 1/4 of candle, this bar is called down covering and it is a sing of sellers domination.
There is also other definition of Outside Bar, especially on the candle charts: its opening and closing must „cover” opening and closing of the bar before. With this kind of thinking, we can find examples when specific candle is a covering one, even that its top and bottom are not covering extremums of the bar before. The first definition, the one mentioned in the beginning, was probably created during observation of pin bar charts, where it is more difficult to spot closings and openings than on candle charts.
What we can consider as Price Action signal?
When markets are moving, they leave patterns or „traces”. These patterns are exactly Price Action, moves of the price showed on the chart, and sometimes thanks to them we can get a hint about next steps of the market. These are signals or Price Action setups or just Price Action strategies.
For us a crucial issue is to find particular Price Action signal that can be used as confirmation of possibility to enter the market and open new transaction. In a minute we will see how to connect Price Action with some relationships on the market, cooperating signals confirming each other, so we can find transactions with high probability of success, but for now we will focus on Price Action itself and at the moment of enter the market according to this strategy.
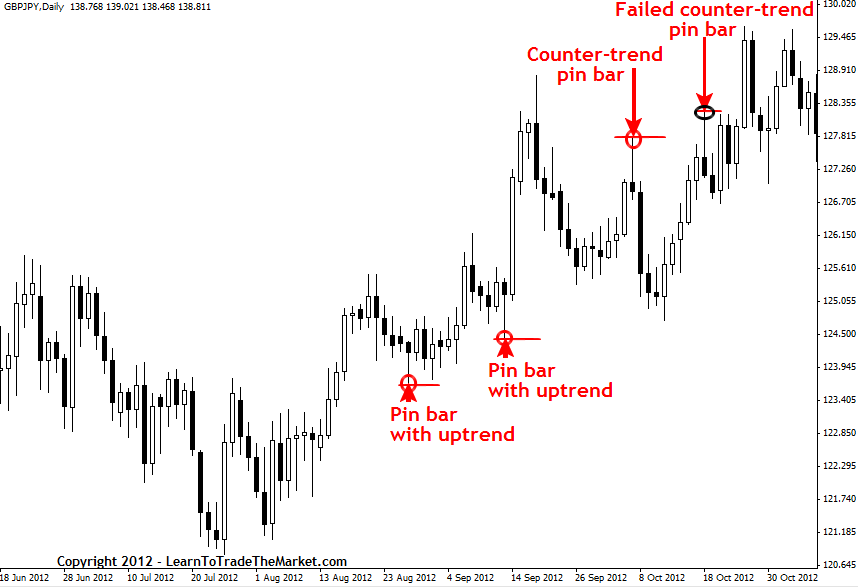
On the chart below we can see examples of my favorite Price Action strategy. It is setup with „Reversal Pin Bar Formation”. This pin bar is also called „Pinocchio Nose”, it is a candle with long wick and short body in the lower or upper part, which „cheat” and looks like a long nose of lying Pinocchio. Firstly it goes quite far up or down, but eventually it reverse and close in the opposite extremum, close to opening point, leaving trace in the form of long wick. Note that in one of the showed examples setup failed, but it is also like that in reality, not every setup will be correct and not every will bring profit.
Price Action and convergence
Convergence is this point or formation in the market, where two or more levels are overlapping, and this is important area. According to the dictionary this word means concurrence or identity. This is why, generally speaking, when we look for convergences, we look for places, where meet two different signals or positions.
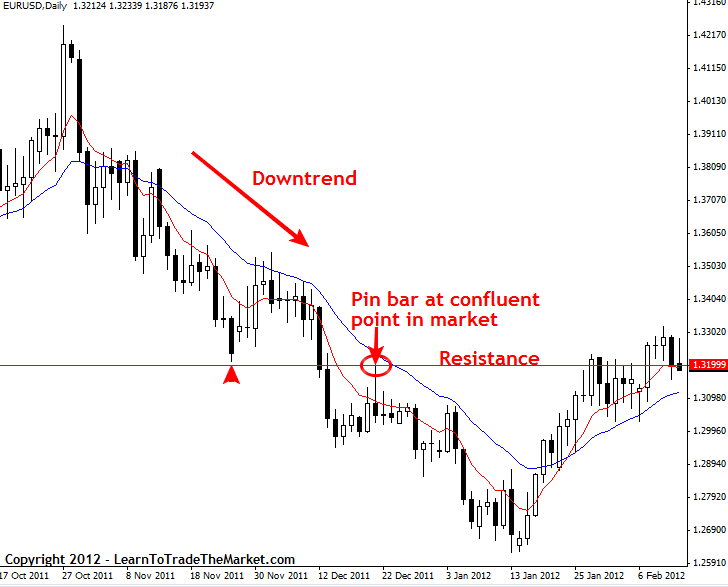
On the chart below there is an example of reading chart with Price Action with convergence strategy. The point or area of convergence makes specific position more important. In this example pin bar shows rebound from clearly seen on the chart resistance line and from dynamic resistance between 8-term EMA and 21-term EMA (red and blue). Another component of convergence on this chart is downtrend. If there will be Price Action setup in direction of trend, like pin bar in this example, it is also a place of convergence. To sum up, we have 3 components, which are coherent and they strengthen signal to open short position with pin bar setup”:
- downtrend;
- rebound of horizontal resistance line;
- rebound of dynamic resistance.
How to use Price Action to define trend
Next chart shows swing highs and swing lows in both trends, up and down. The price on the chart with this time frame is in uptrend if it creates new maximums – HH (Higher High) and higher minimums – HL (Higher Low). There is down trend when we can spot lower maximums – LH (Lower High) and lower minimum – LL (Lower Low). If the price is doing anything different, it is in consolidation: it moves in certain range, triangle, flag, rectangle etc.

It is said that trend is actual as long as price is reaching higher highs and lows (uptrend) or lower highs and lows (downtrend). When trend is broken, there is generally term of consolidation, which is easier to spot on the chart with lower time frame. With gaining experience you will surely spot what is going on the chart, without changing time frame.
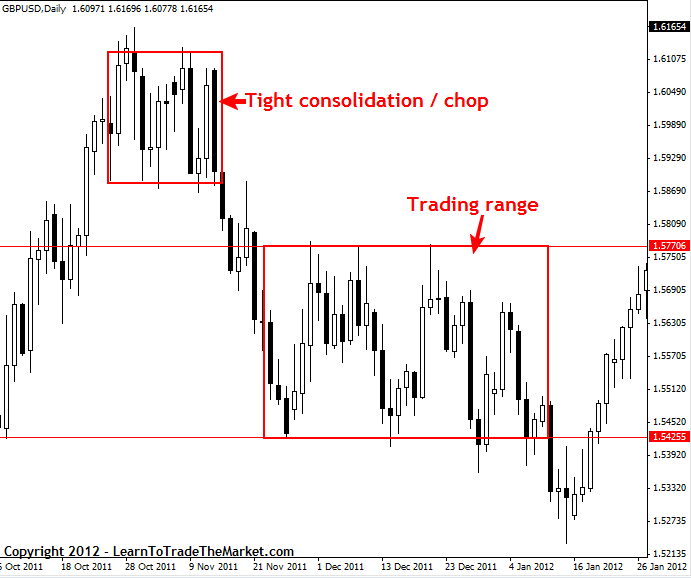
If the price is in the tight consolidation, it is often said that it is moving sideways. If it is wider, it is said that price is moving in trading range, without clear sequence of ups and downs, which could point solid trend. On the chart below we have example of both narrow consolidation and wide trading range:
Using Price Action to follow trend and in terms of consolidation
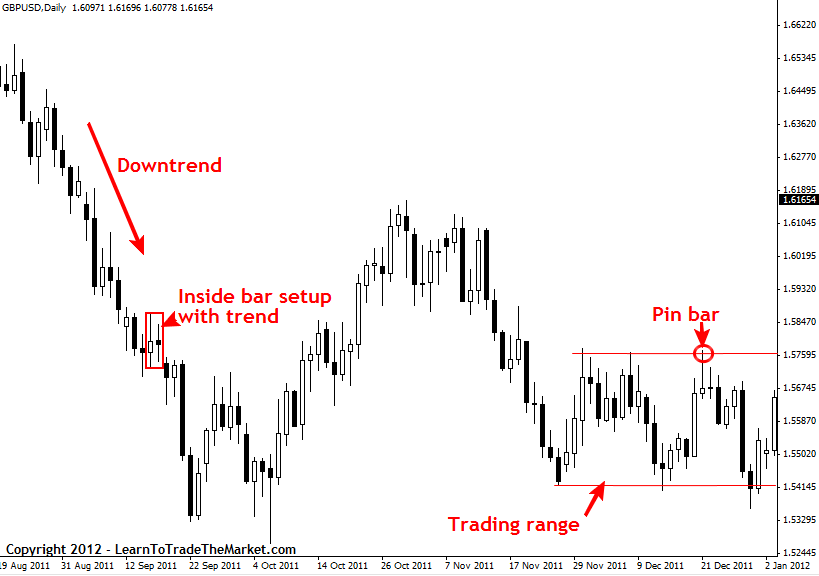
“Moving with trend” is quite general idea, often creating many problems to beginner traders, which still don’t have effective strategy. My idea of moving with trend is just about finding Price Action setup on the daily chart which gives high chance of success and it is the best if it will be also coherent with the trend seen on the chart, creating convergence. However trading on the market in consolidation is better when this consolidation has some range, limits where price can rebound. It is better when it is wider consolidation than just move sideways. You can also use narrow consolidation to earn some money but then more helpful are charts with smaller time frame. It is better to get some experience in Price Action on the daily chart.
The chart below is a perfect example of using Price Action strategy to move with trend and during time of consolidation:
In the end…
Now you have some solid basics about Price Action strategy. For now I didn’t mentioned which time frames you should use in the beginning of learning. All the charts above show daily time frame and it is very important to first learn trading on this interval before you use smaller one. The reason is simple: daily chart gives the most clear and precise price movement. Smaller time frame – the image is more disturbed and price movement random, with noise. Same like every building needs solid fundaments, you as a beginner trader need to get some solid basics of effective trading and this is why it is the best to learn on daily time frame.
The strategy description is based on Learn to Trade The Market materials. Charts were prepared and described by Nial Fuller – Australian Price Action guru.


