 “Search, Analyse, Trade” is a series of analyses for Price Action and Elliott Waves. Its detailed step-by-step description can be found over here. I invite you to today’s review of selected currency pairs and potential trading opportunities.The analyses are based on the Dukascopy sentiment that can be seen here.
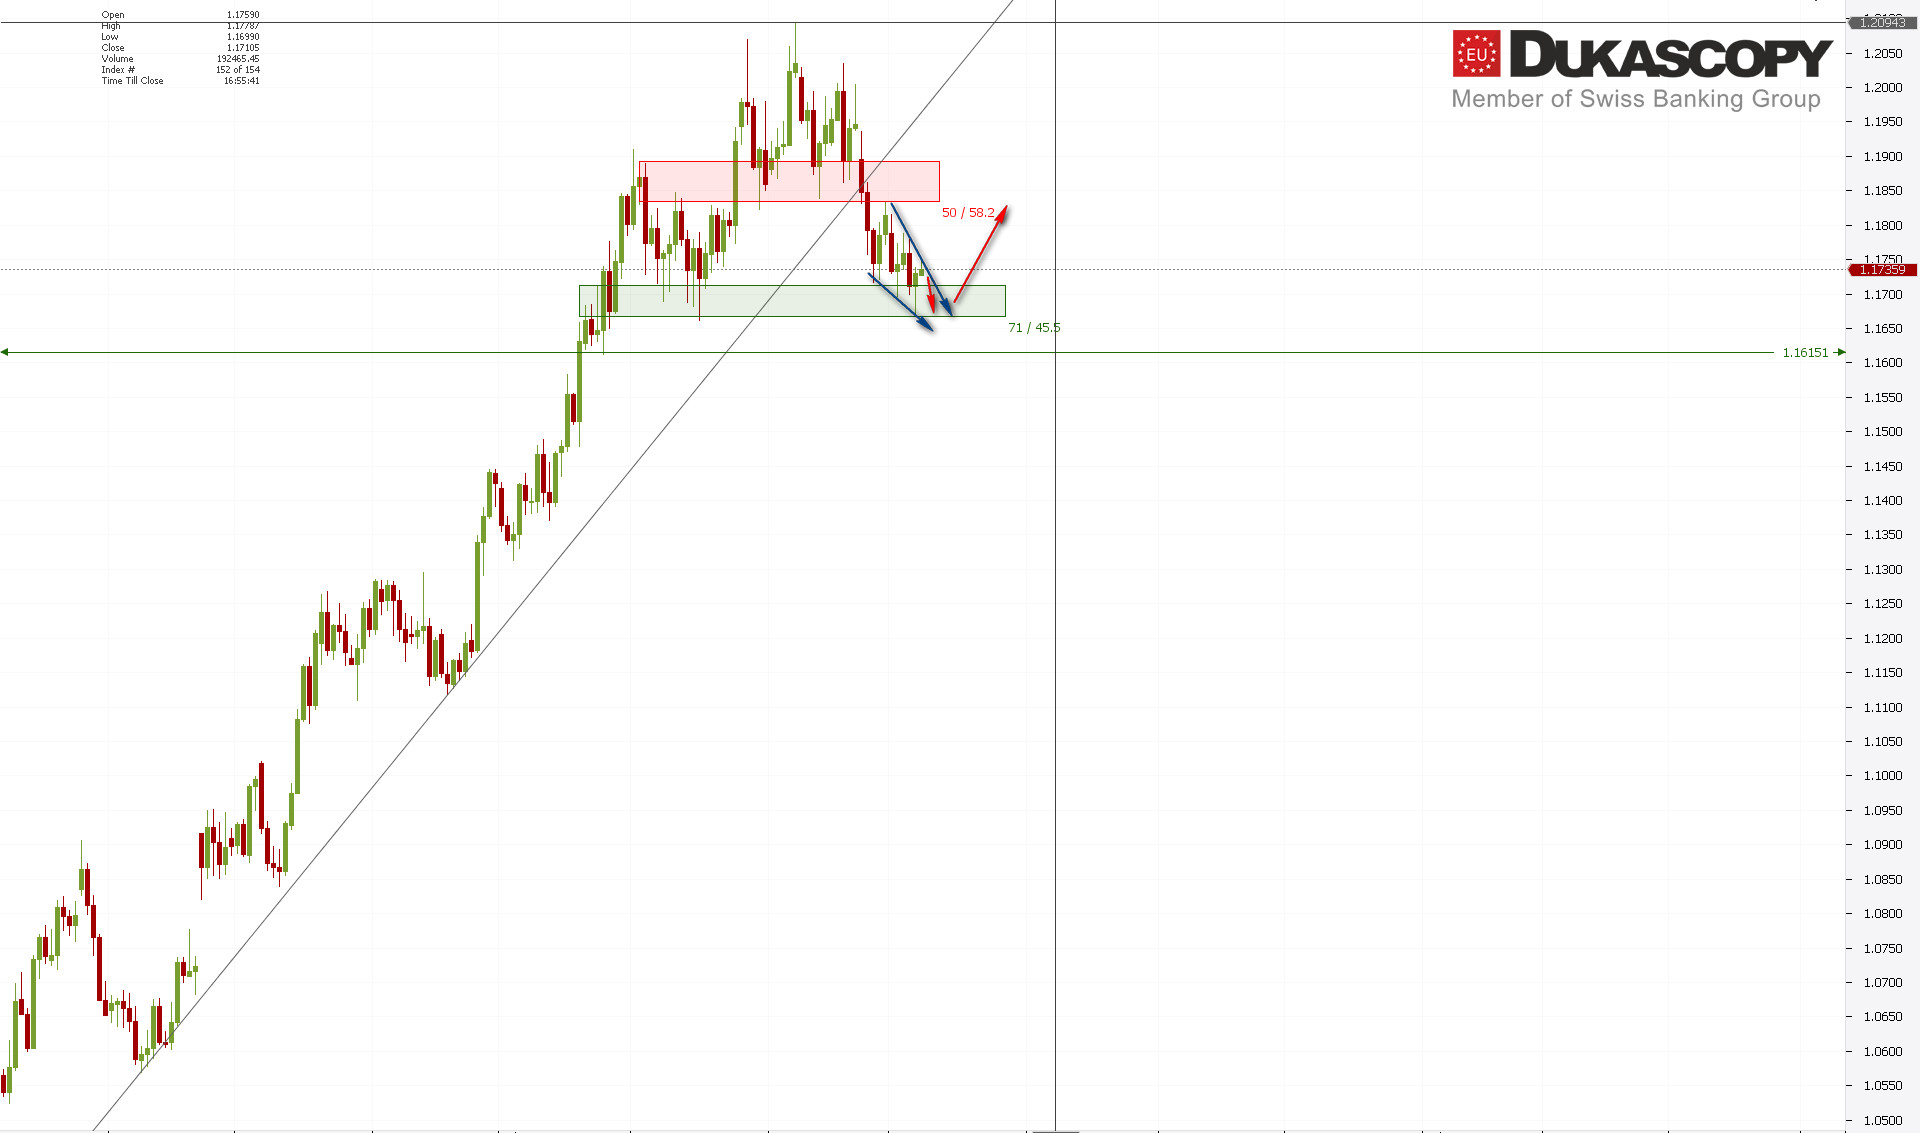
EUR/USD once again tests the demand zone. On the daily chart we see a Pin Bar rejecting level. Since the last decline is slowly beginning to resemble ending triangle, we can expect correction of recent declines. If the pair actually moves north, the target area for such movement should be the resistance zone located in the vicinity of the left arm of the potential H&S formation.
Over the weekend, the sentiment graph looks neutrally with a slight advantage of bulls. If the triangular formation is finalized and there is a formation that rejects the currently tested support level, we can consider trade expecting movement tor the right arm of the H&S.
GBPUSD
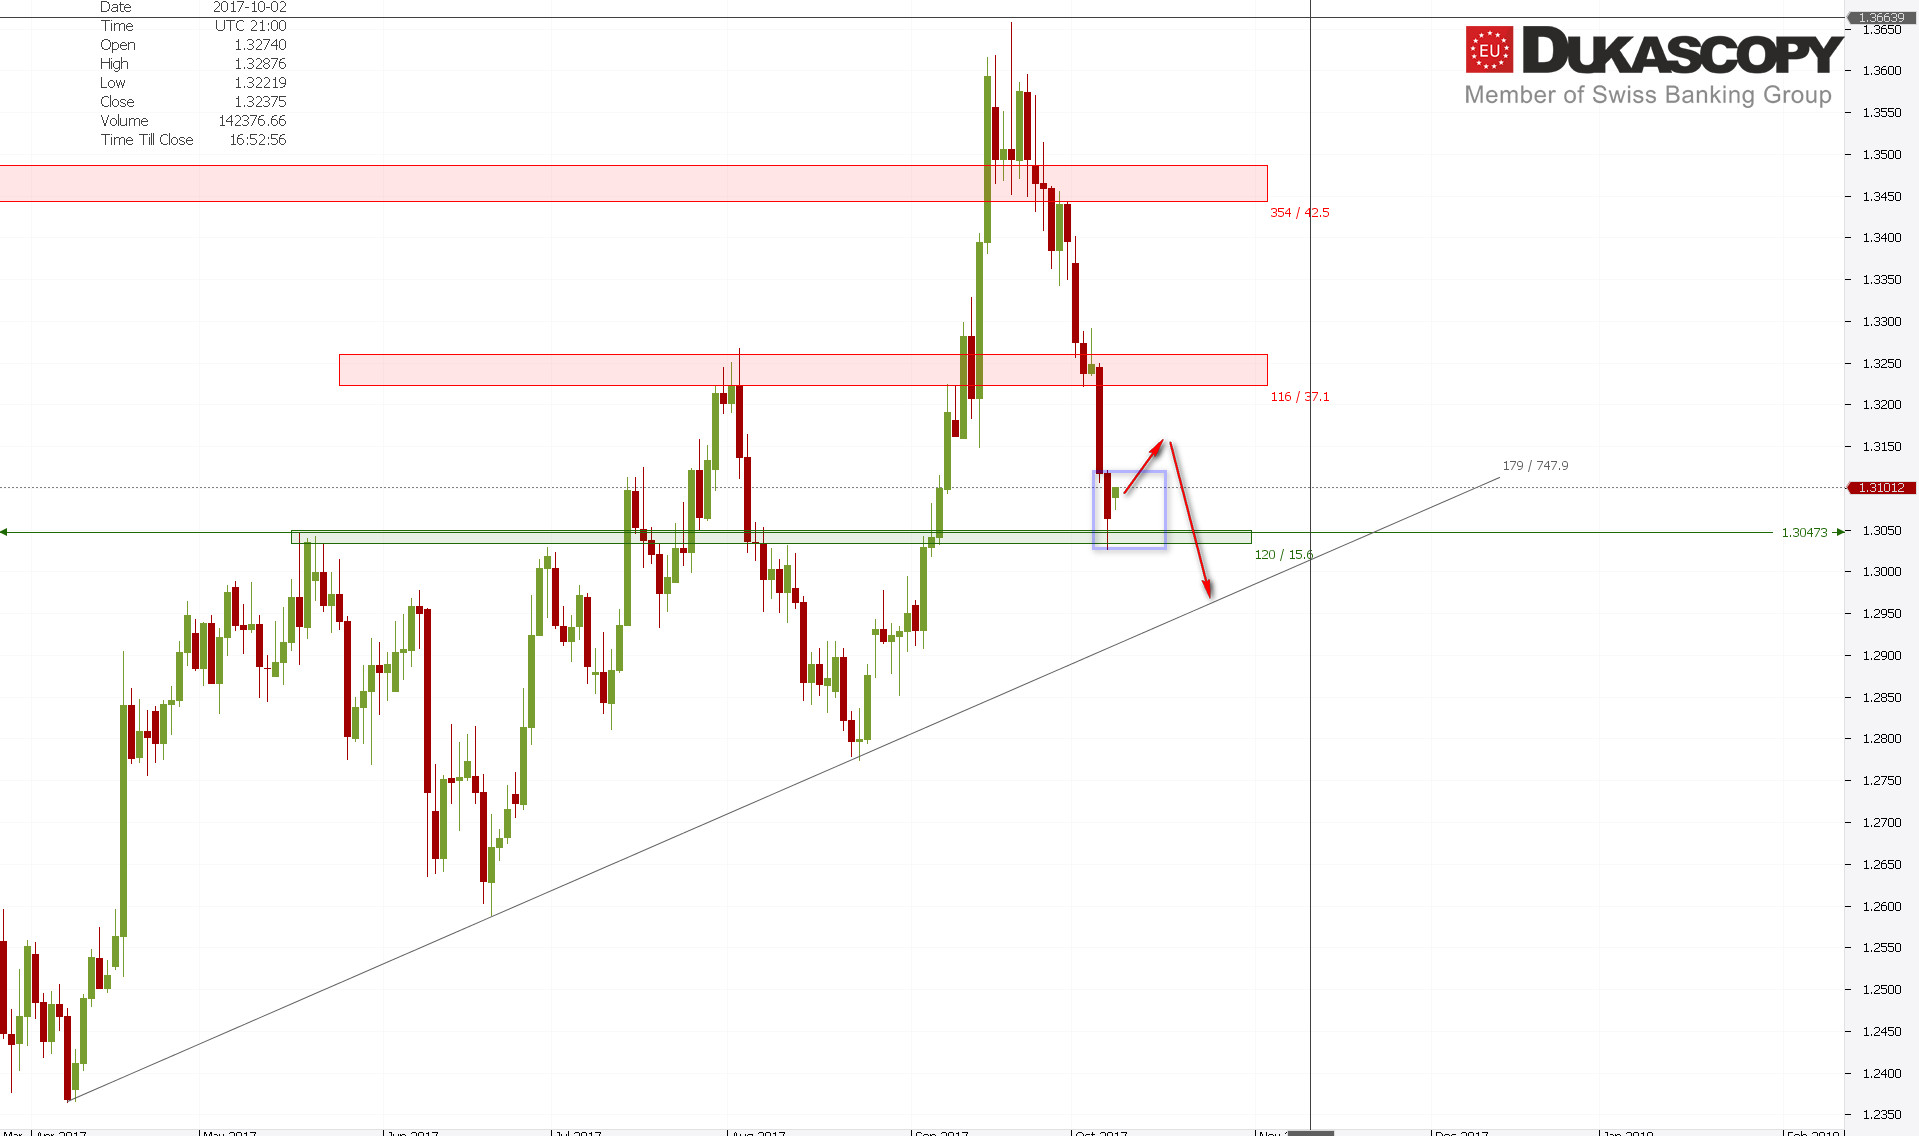
GBP/USD bearish move has strengthened. The declines reached vicinity of round level1.3000 and tried to react to it. Looking at the strength of the last impulse, the upward movement will probably only be a correction and after that we will see continuation of the downtrend towards the trend line. There will be an impulse that should have its continuation, and as a result we should see breaking of the mentioned line and a move towards 1.2780.
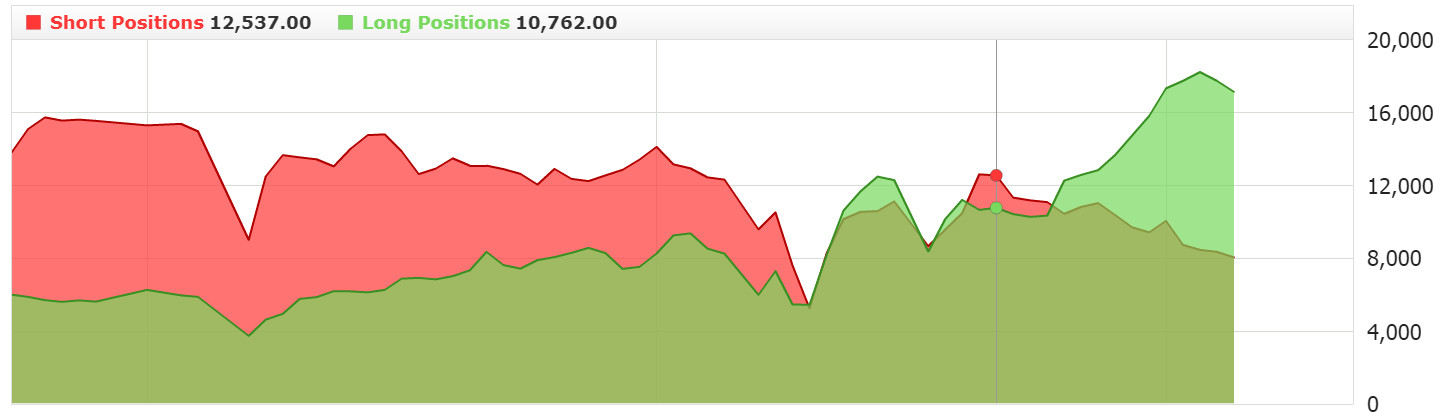
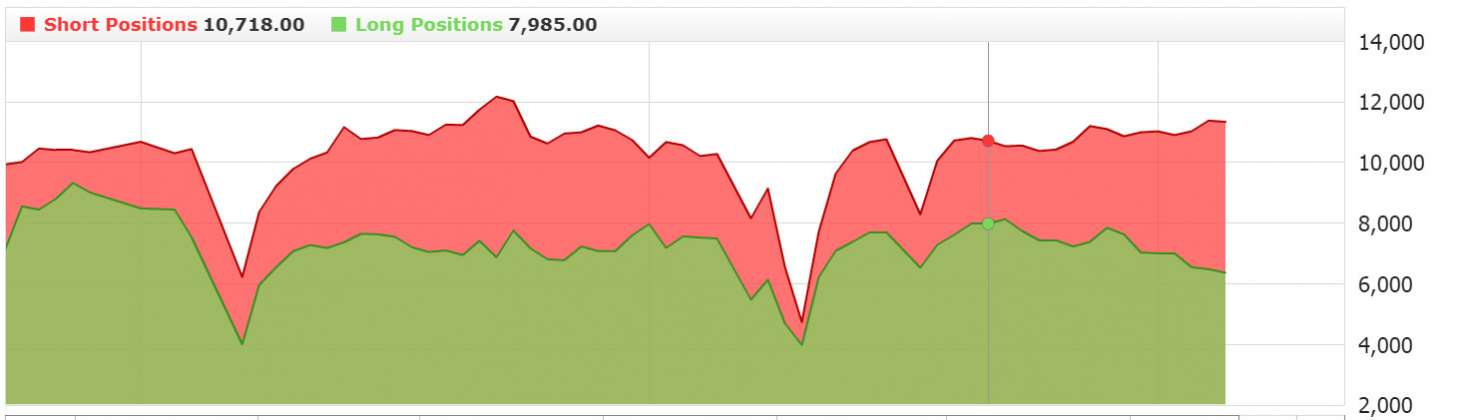
The sentiment points on a reflection. We have a continuous increase in long positions and reduction of shorts. Looking at the momentum and its strength, the rise of short positions is a consequence of averaging the positions, so I stay on side.
USDJPY
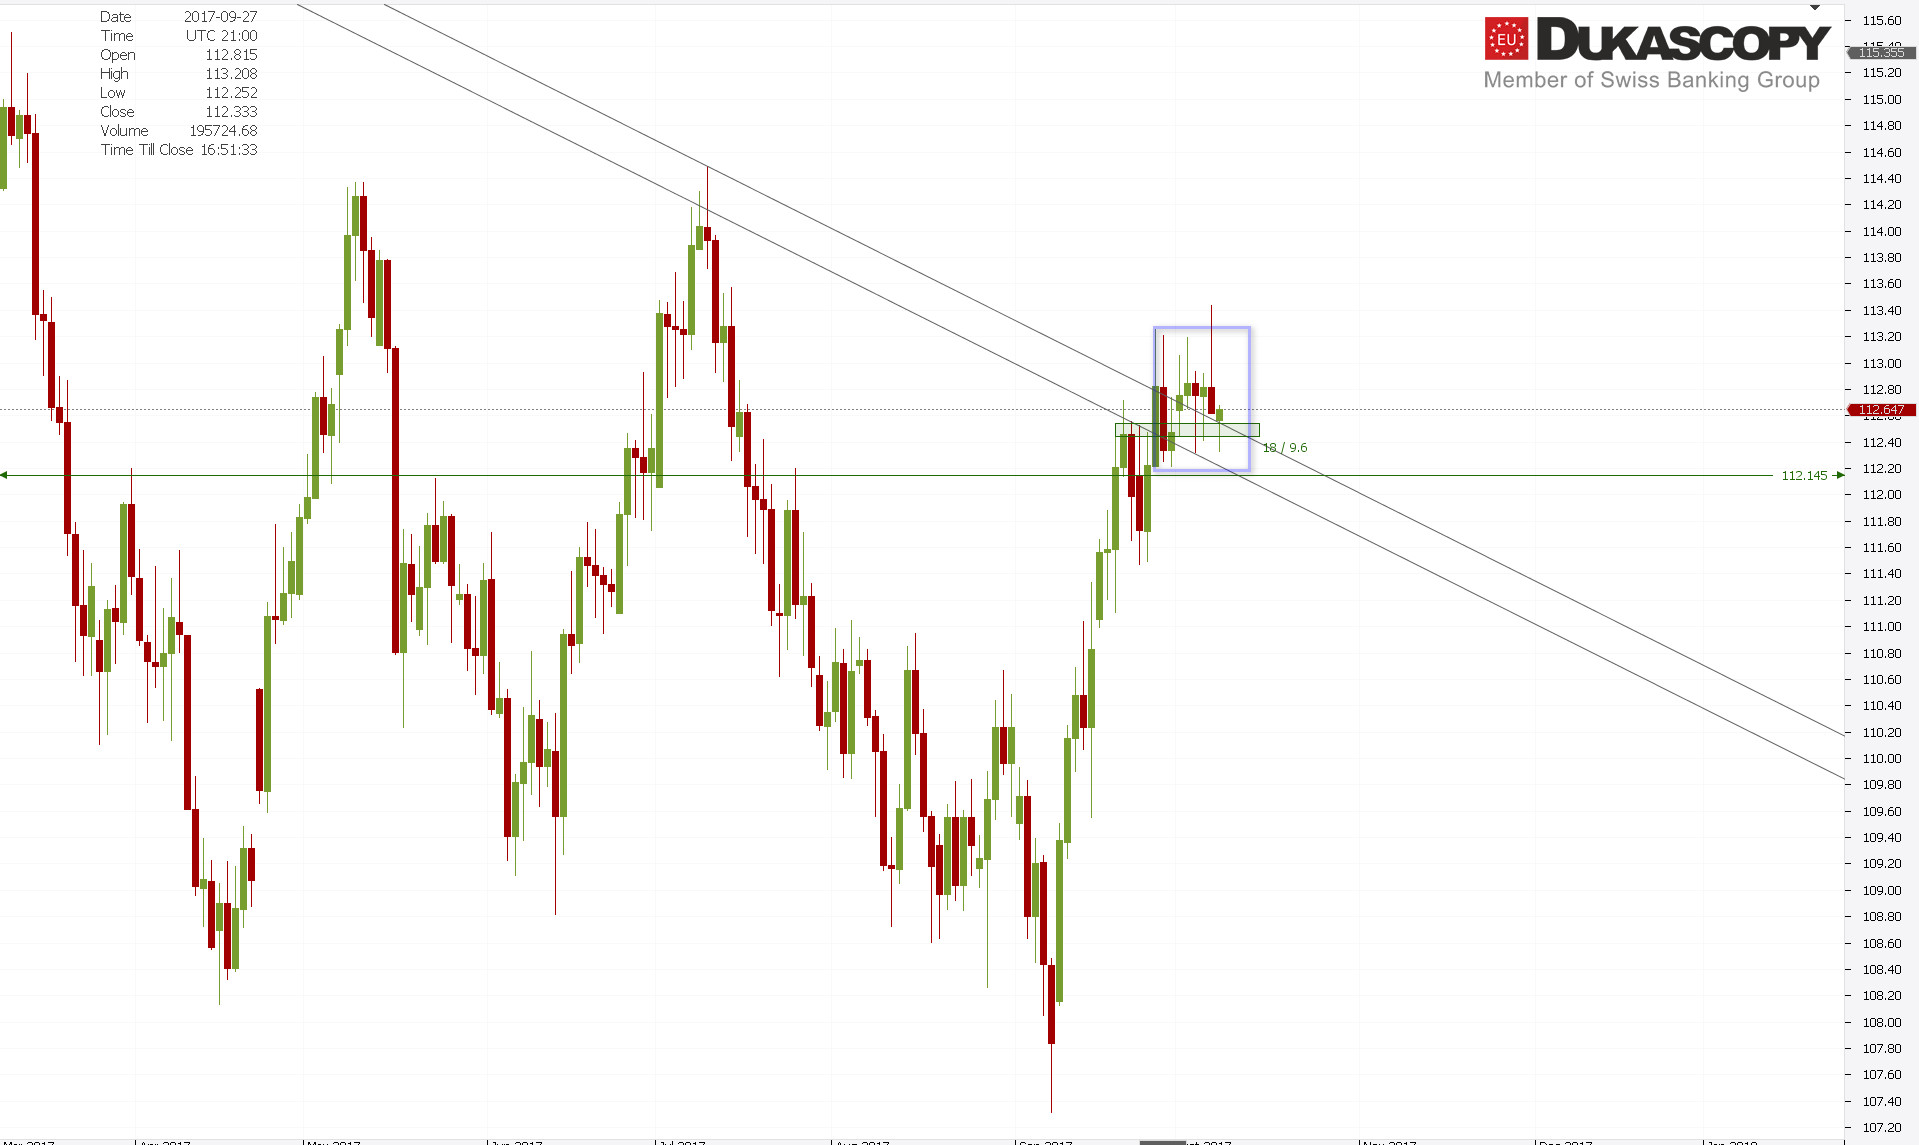
USD/JPY– on chart we see a false breakout from Inside Bar in conjunction with a Pin Bar. This is a strong bearish formation, but until price will overcome the important and currently tested level of support I would abstain from deciding to open a short position. This level was repeatedly discarded with Pin Bar candles and seems to be a key handle. Its breaking should lead to a decrease to the level of 111,600.
The sentiment favors the Fakey formation that was created on the chart, but I am staying aside not opening position until the support is breached.


